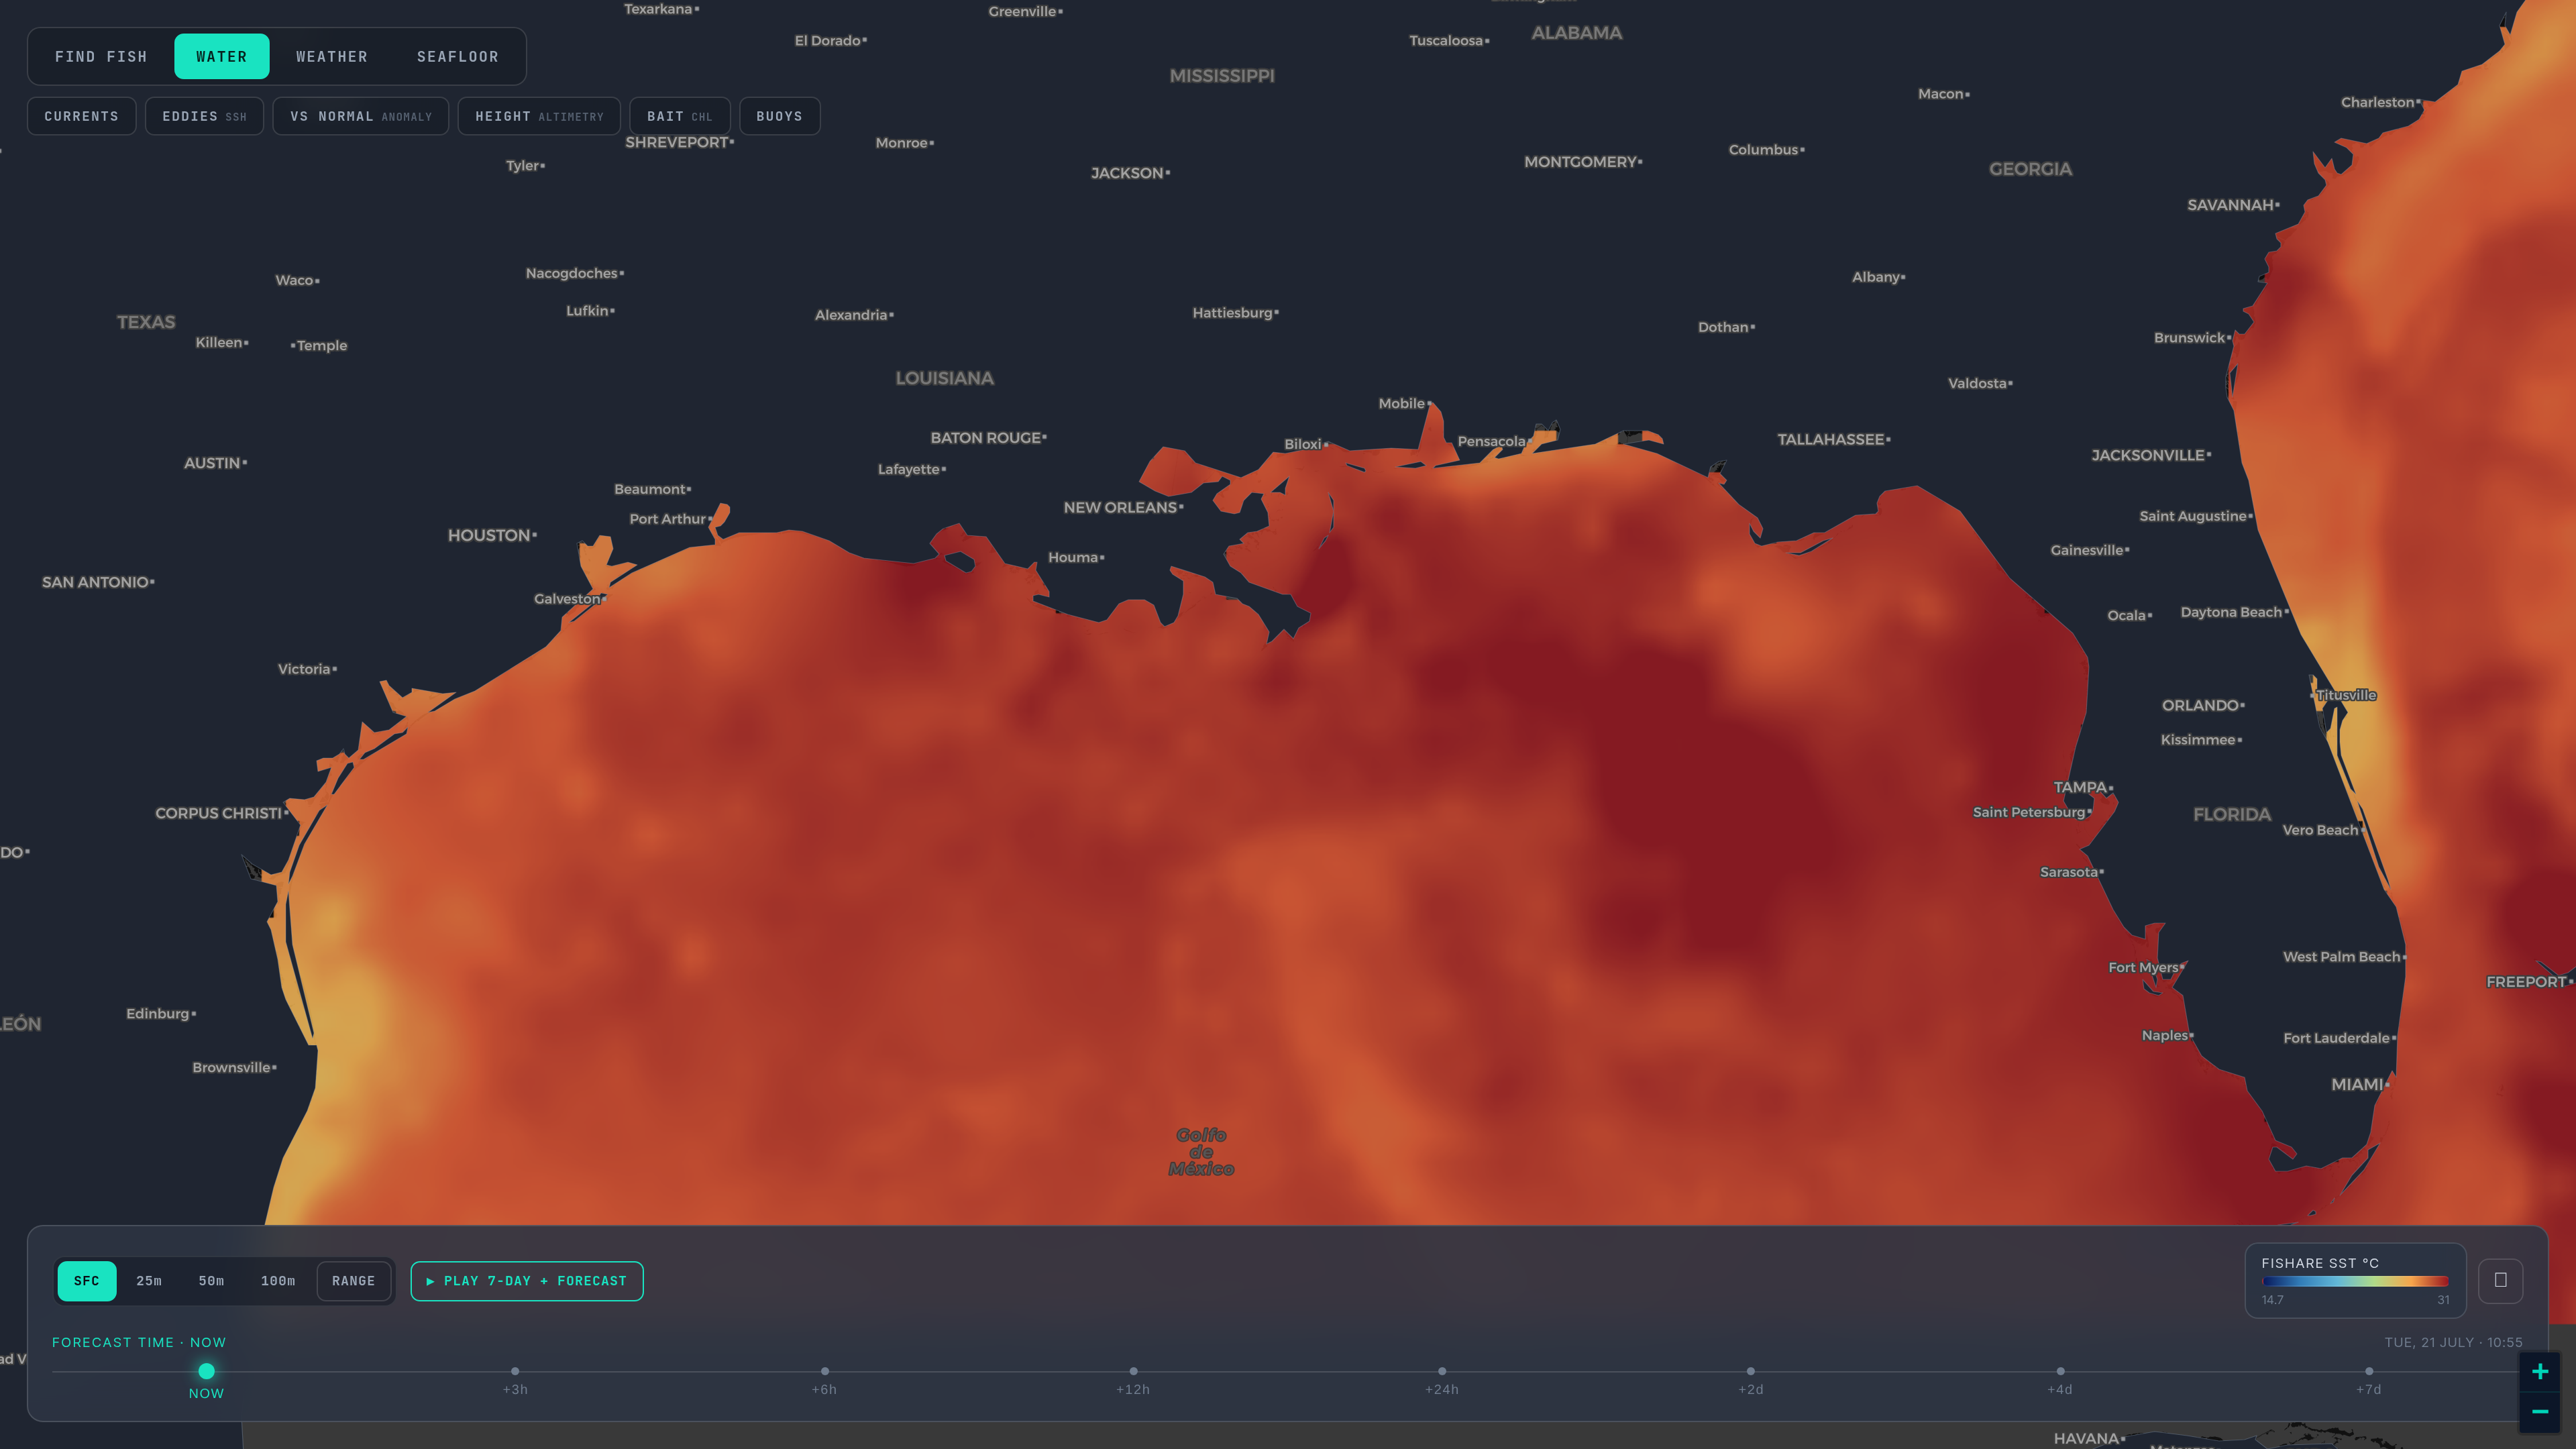
Start with what the satellite saw. Use the model to ask where it is going.
Part 6 of six. Each tip ends with a tag such as sst_break_definitionA: the rule it rests on and that rule's confidence grade (A agency or peer-reviewed, B two or more practitioners agree, C one practitioner or anecdote, I a property of our own bake). Tap a tag to read the rule and its sources. Degrees F and miles, as on the US Gulf map.
Everything on an SST chart is one of three things, and it pays to know which.
- Observed. The passes and the hourly frames: what a satellite measured, as it measured it, with holes where it could not see. Every one carries its satellite and its time, because an edge a day old has moved. The last 72 hours sit in the strip, and 30 days of passes and daily composites are kept behind the HISTORY control; the archive has been filling since October 2026. pass_age_and_freshnessB
- Analysed. The daily gap-filled field: observations merged and filled under the cloud with a model, so it is smoother and always whole. It shows the zones, not the knife edges, and it carries its own date. cloud_free_products_are_modelsB
- Forecast. Five days ahead from the Copernicus Marine ocean model, drawn on the same map as seven days of playback. This is a model's expectation, not a measurement. The surface salinity layer and the six subsurface depths are model output too, and the map labels them so. forecast_vs_observedB
A model is a gap-filled field by nature: it draws the general zones, where a current runs, where a large eddy sits, and not the sharp, small, fast edge that a fishing break often is. Expect it to draw a softer, wider edge than the satellite saw, and sometimes a few miles from it. cloud_free_products_are_modelsB forecast_vs_observedB
So use the two in order.
1. Read the observation first
Open the newest clear pass over your water and mark where the break is. That is today's fact, and it overrides the model wherever they differ. forecast_vs_observedB
2. Ask whether the model agrees with today
Step the forecast slider to today and compare. If the model puts the edge within a few miles of the observed one, it is tracking the water and its next days deserve some weight. If it is well off, discount the days that follow; it started from the wrong place. We publish no skill score for the forecast, because you can check it yourself every morning against the pass. forecast_vs_observedB
3. Ask which way, and how fast
Step forward. Is the edge moving toward you or away? Is the eddy drifting onto the grounds or off them? Direction and rate are what a forecast is for; position is what the satellite is for. Shift a waypoint toward the forecast position only when the pass-to-pass drift agrees with it. forecast_vs_observedB sst_break_moves_track_speedB
4. Look back before you look forward
Scrub the last seven days of playback, and the 30-day history where the region has it. If the edge has been drifting east a mile a day for a week, a forecast that continues it is believable; one that reverses it needs a reason. And a front that keeps coming back to the same place over weeks, a shelf-slope front or a canyon tip, is a frontal zone: the kind of place fish forage reliably, and worth more than any single day's line. history_30_day_persistenceA
5. Re-check the morning of
The forecast is a plan. The first clear morning pass is the verdict, and on a calm day the morning pass is the one to trust over an afternoon one. hourly_morning_edgeA
What to do when they disagree
Trust the observation for where the water is now. Trust the forecast, cautiously, for where it is heading. If both matter and they differ, plan for the observed position and treat the forecast as a reason to check again sooner. Whatever frame you are looking at, read its date and its label: a forecast frame is never an observation, and the map says which is which. forecast_vs_observedB
What a forecast cannot do
It will not capture the small, sharp front that a day of wind or a passing low builds in an afternoon; that is the kind of feature the pass sees and a model smooths. cloud_free_products_are_modelsB And it knows nothing about cloud, so its five days look complete whether or not a satellite will be able to see them. That last point matters: the day the model says the edge arrives is also a day you may have no clear pass to confirm it, and then the honest read is too cloudy to call. too_cloudy_to_callI
A last honest note
None of this tells you where the fish are. It tells you where the water is and where it is going, which is the part you can know before you leave the ramp. honest_hedge_languageI The habitat score that sits on top of the map is that same reading folded into one number per species, in the regions that carry it; it scores conditions, not fish.
Back: Part 5. The overview: How to read SST and habitat maps. The series start: Part 1. The rules: How we read SST.
Open the map and drag the forecast slider. If you pay for satellite charts one region at a time, the switching guide compares the forecast horizon and the price.