The afternoon edge looks great. Check it again in the morning.
Part 4 of six. Each tip ends with a tag such as sst_break_definitionA: the rule it rests on and that rule's confidence grade (A agency or peer-reviewed, B two or more practitioners agree, C one practitioner or anecdote, I a property of our own bake). Tap a tag to read the rule and its sources. Degrees C and kilometres, as on the Australian east coast map.
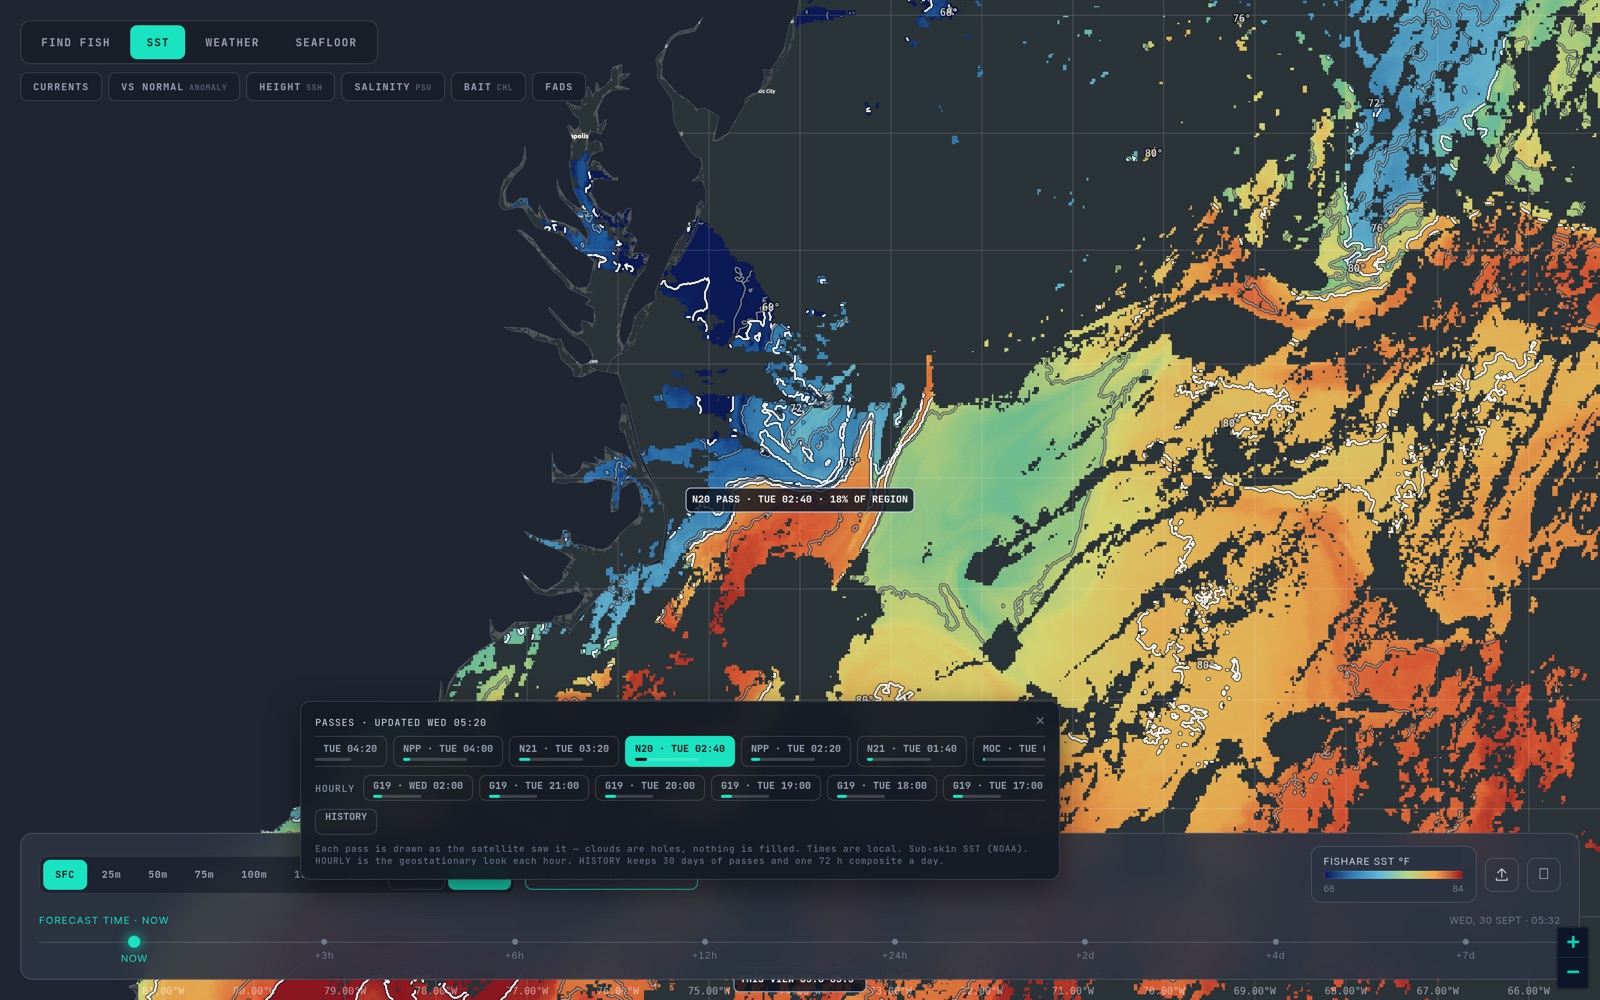
The polar satellites that make the passes cross any given coast only a few times a day. Between them there are hours when no new clear look arrives. Geostationary satellites fill those hours. They sit fixed above the equator, GOES-19 and GOES-18 over the Americas, Himawari-9 over Australia, New Zealand, Japan and the South-west Pacific, Meteosat over the UK, and they see the same patch of sea every hour. Fishare publishes each of those hourly frames as observed in the HOURLY row of the pass strip.
They are not better than a polar pass; they see only what the cloud allows that hour. What they add is time, and time is what sorts a real edge from a sunburnt one. hourly_morning_edgeA
The problem: the sun warms the top of a calm sea
On a flat, bright day with little wind, the top layer of water absorbs heat faster than it mixes down. The skin that a satellite reads can warm by several degrees above the water underneath, five in the worst case, and it does so unevenly: patches that are calmer or clearer warm faster than the rest. The result is an afternoon temperature break that is partly the sun and not the water. A satellite faithfully draws it. It is gone by morning. hourly_morning_edgeA skin_vs_boat_thermometerA
You can see this with the hourly frames. Step through a day of them:
- An edge that was there at dawn and is still there at 3 pm is a water-mass boundary. It survived the sun. hourly_morning_edgeA
- An edge that builds through the morning, peaks mid-afternoon and has weakened or vanished by the first frames of the next day was largely sunburn. hourly_morning_edgeA
- An edge that moves a few kilometres between frames is a front being pushed by current or wind, and the frames show you which way and how fast. sst_break_moves_track_speedB
Wind changes the answer
Diurnal warming needs calm. On a windy day the surface is stirred down through the top few metres, the skin and the water under it agree, and there is little warm film to paint a false edge; so an afternoon break on a windy day is more believable than the same break on a flat, glassy one. Check the wind and swell for the day before you decide how much sun to blame. skin_vs_boat_thermometerA
Which satellite covers your water
GOES-19 supplies the hourly frames for the US East and Gulf, the Caribbean, the Eastern Tropical Pacific and the Canadian Maritimes; GOES-18 for the US West Coast, Baja and Hawaii; Himawari-9 for the whole of Australia, New Zealand, Japan and the South-west Pacific; Meteosat for the UK.
Use the morning edge for position
The cleanest picture of a day's water is the one taken before the sun has had a go at it. Crews who read single passes use the images from between one and six in the morning; the VIIRS satellites cross near 1:30 am, and the hourly frames from before about 9 am tell the same story between passes. Those are the looks to trust for where the break really is. The 1:30 pm passes are valuable for coverage, not for the finest read of a surface edge on a calm day. hourly_morning_edgeA
A workable dawn-departure routine
- The evening before, open the 72-hour composite and pick your water: the shape, not the line. composite_vs_passB
- Open last night's passes over it, if they were clear, and read the edge off the newest one. pass_age_and_freshnessB
- Open the hourly frames from early that morning. Do they agree on where the edge sits? hourly_morning_edgeA
- Check it at 50 metres in the depth ladder. If the step is still there at 50, it is a water-mass boundary, not a skin effect; the ladder is a model, so treat agreement as support, not proof. subsurface_confirms_break_depthB
- Go where the morning edge is, not where yesterday afternoon's was.
Two caveats. Hourly frames are single-look and cloud kills them fast; on a cloudy day the row will be mostly empty, and that is the chart being honest. too_cloudy_to_callI And they are the same skin temperature as the passes, so they cannot see what is happening at depth. skin_vs_boat_thermometerA
Next: Part 5 — Chlorophyll colour lines. Back: Part 3. The overview is in How to read SST and habitat maps; the rules tagged above are on How we read SST.
Open the map and open PASSES, then HOURLY. The switching guide lists which satellites cover which region.