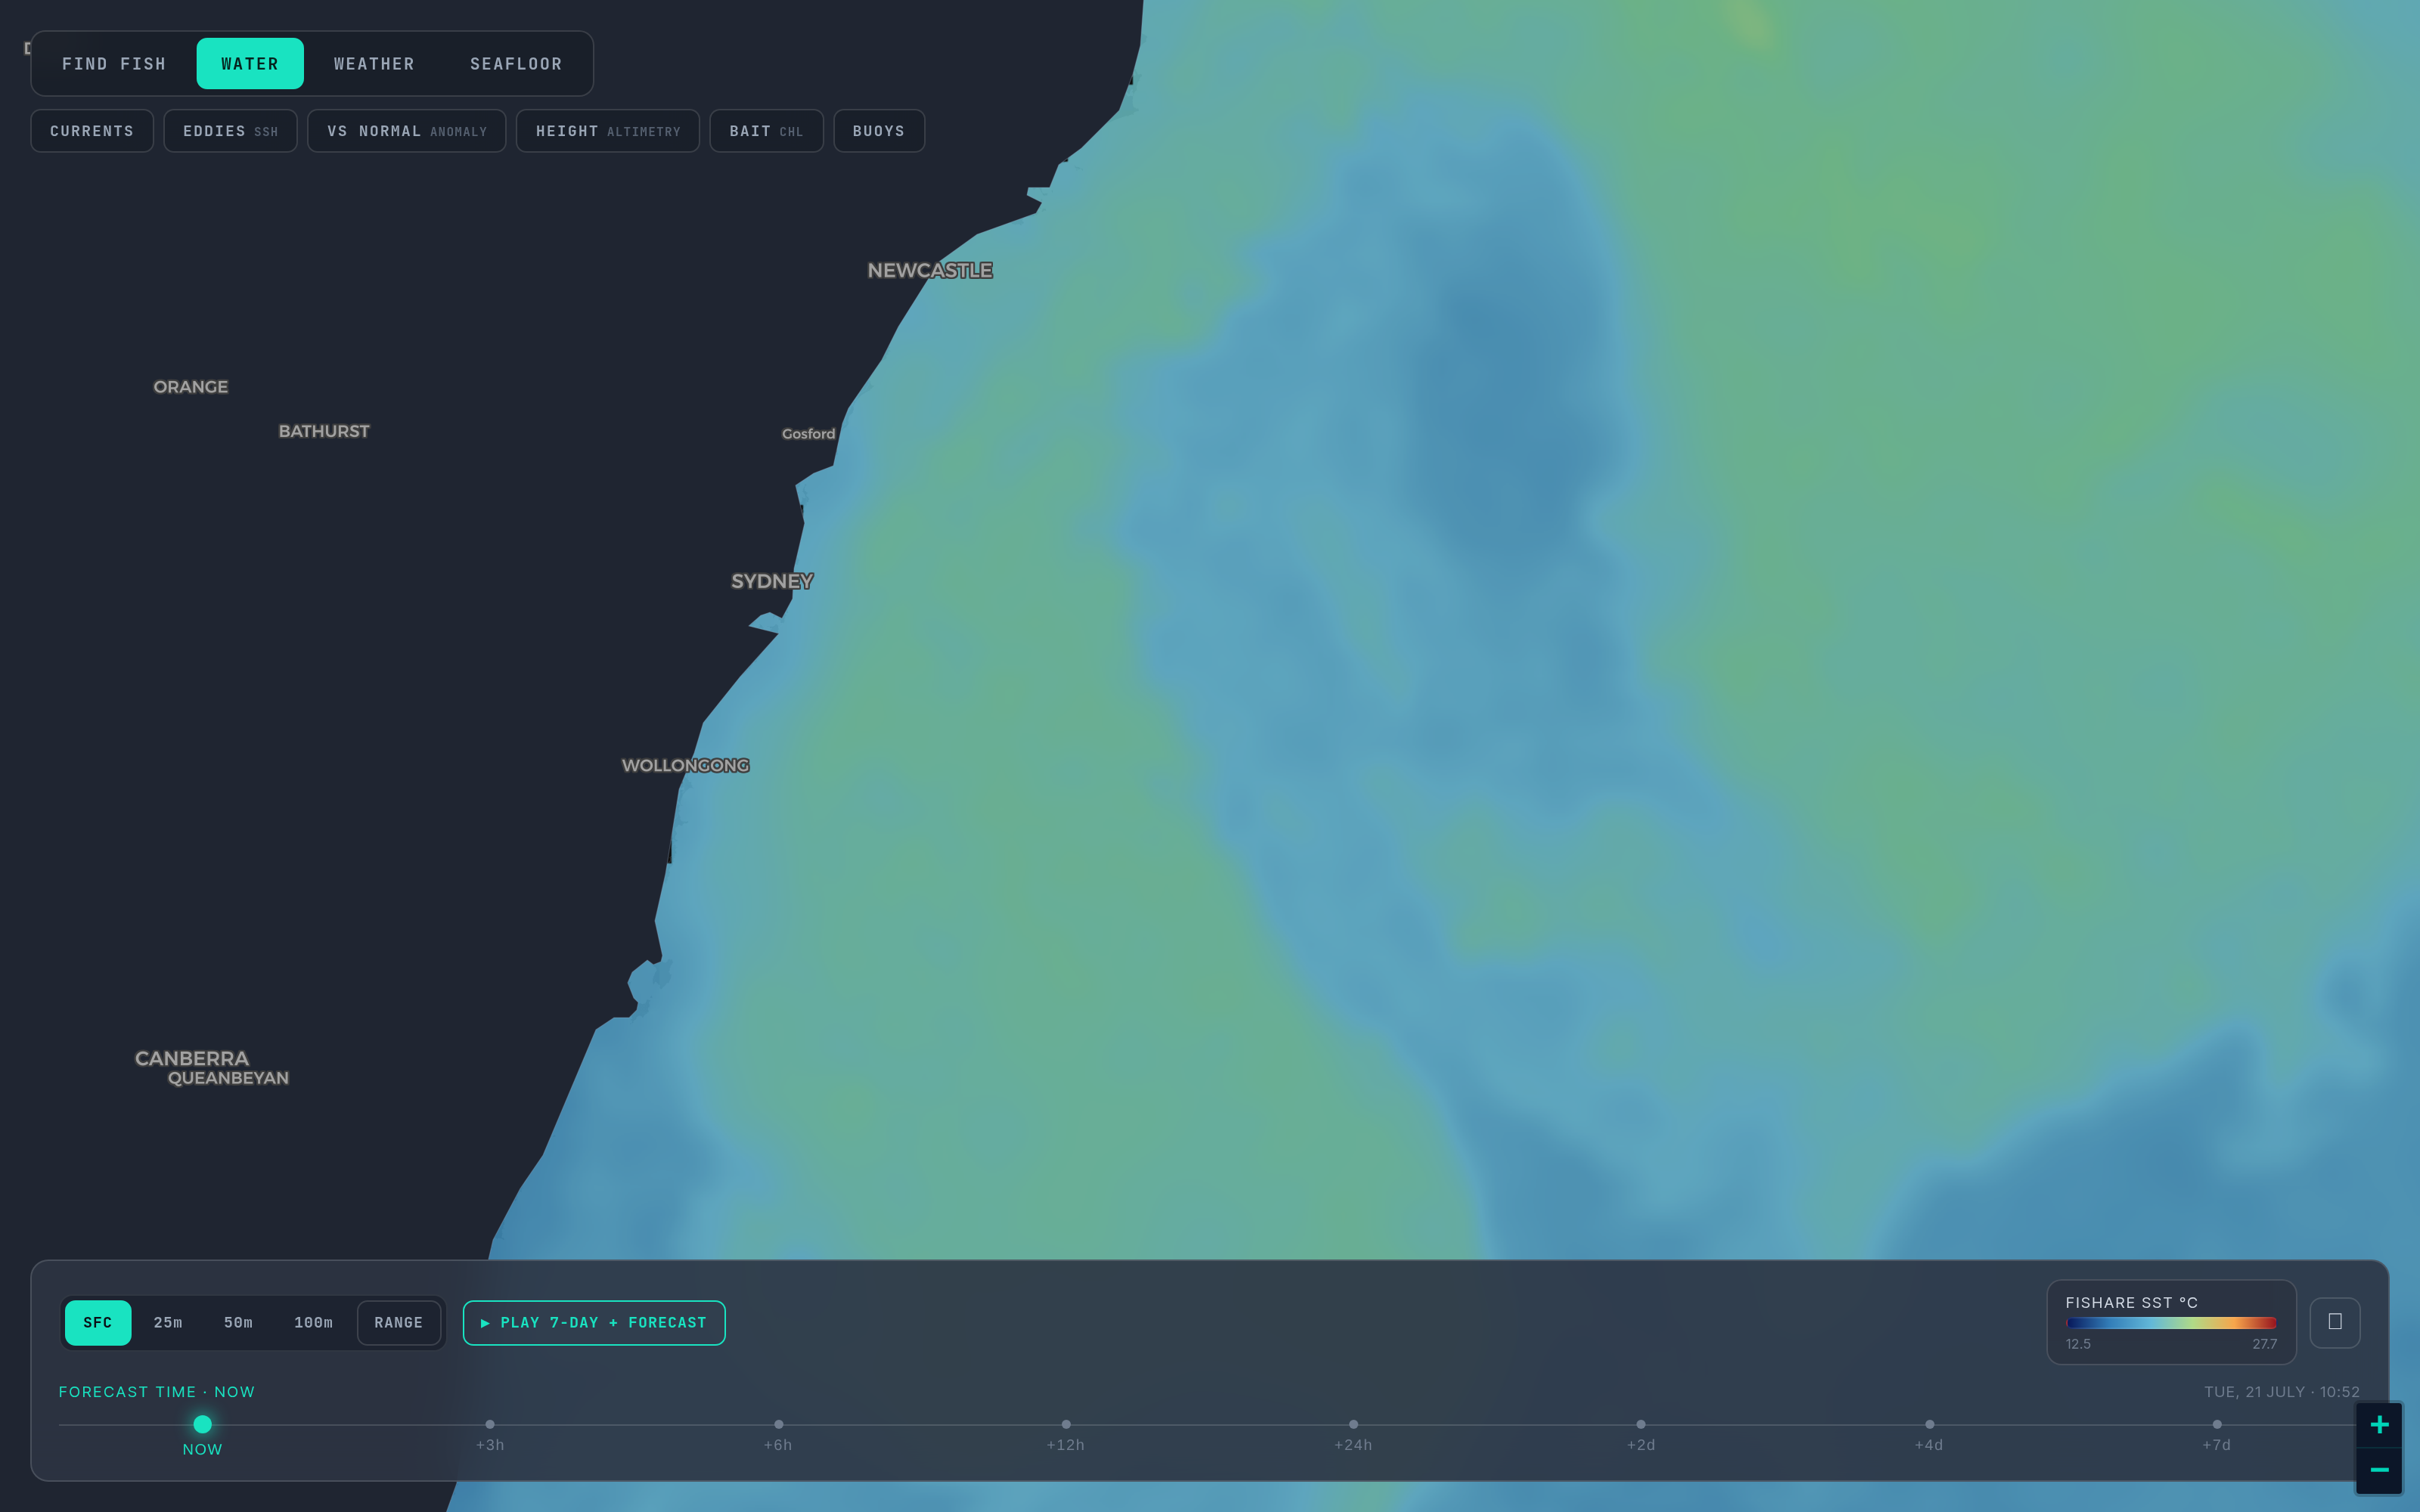
Temperature tells you where the water changed. Colour tells you what that change did to the food.
Part 5 of six. Each tip ends with a tag such as sst_break_definitionA: the rule it rests on and that rule's confidence grade (A agency or peer-reviewed, B two or more practitioners agree, C one practitioner or anecdote, I a property of our own bake). Tap a tag to read the rule and its sources. Degrees F and miles, as on the US West map.
Satellites that carry an ocean-colour sensor, the VIIRS instruments among them, measure how much sunlight the sea scatters back and in which colours. Phytoplankton, the plants at the base of the food chain, absorb blue light and reflect green, and chlorophyll is how we count them. More chlorophyll means more plant life, which means more of what bait fish eat. That is why anglers talk about blue water and green water, and why a clean line between them is worth finding: the colour line is where the food chain meets the clear water predators hunt in. chl_colour_line_blue_meets_greenB
How Fishare draws it
One image per satellite per day, at 0.0225 degrees, plus a three-day composite, because ocean colour needs sunlight and clear sky and loses more to cloud than infrared does. The ramp is fixed, not stretched to the view, so a colour means the same number every day and on every screen: deep navy for very clear water near 0.03 milligrams per cubic metre, blue near 0.1, teal near 0.4, green near 1, yellow-green near 3, and the pale bloom colour at 10. Temperature is a relative picture and chlorophyll an absolute one, which is why the ramps behave differently. Use the numbers for the edge, not as a threshold: absolute values differ by sensor and algorithm, the useful band offshore is roughly 0.2 to 1, and the very bluest water past the first colour break holds little life. chl_values_bandA
What to look for
- A colour line that sits on a temperature break. This is the strong case: not temperature or colour but temperature and colour, a boundary that has changed the food as well as the heat. In the Pass Read a chlorophyll edge counts when one side of the line holds at least one and a half times the chlorophyll of the other, and the read says which side is greener. chl_with_temp_break_stacksB
- A colour line with no temperature change. Colour and temperature fronts do not always coincide. A food edge without a heat edge is still worth a look. chl_with_temp_break_stacksB chl_colour_line_blue_meets_greenB
- A temperature break with no colour line. Common, and fine, but a break sitting in uniformly blue water on both sides holds passing fish only; without the base of the food chain the boundary cannot hold bait. The case then rests on the other checks in Part 2. sst_break_in_sterile_blue_waterB
- The blue side. Crews on this coast find the offshore tunas on the clean side of a colour edge, making forays into the green where the bait lives. Treat that as a tendency, not a law: bait beats clarity. The line is the thing; sit near it. chl_species_preference_cleanB
Where green is only mud
Close to the coast, rivers and surf stir up sediment and dissolved organic matter, and the sensor reads that as chlorophyll. Inshore green next to a river mouth, or along a shallow bank after a blow, is usually run-off: cold, dirty and not the plankton-rich oceanic green that holds bait. Treat the colour line as meaningful in deeper water, and be sceptical of any green hugging the shore. chl_coastal_runoff_false_positiveB
A two-minute routine
First find the temperature break on the newest clear pass. Then switch to chlorophyll and read the date on the satellite day before you read the colour: ocean colour is one frame a day at best against a dozen SST passes, so the colour frame is usually a day or two older than the pass. chl_image_is_olderB Look for a colour change along the same line, and note which side is greener. chl_with_temp_break_stacksB Then check it against the three-day composite, which has fewer holes, to see whether the line is real or just where the clouds happened to be; the composite blends days, as Part 3 explained. composite_vs_passB If the colour line, the temperature line and the height line all agree, you have the strongest read the charts can give. ssh_confirms_sstB
Biology lags physics
A temperature break can move in a day; the plankton and the bait take days to assemble on a new boundary. sst_break_persistence_three_daysB So a day-old chlorophyll image next to this morning's pass will not line up pixel for pixel: project the colour edge forward by the break's drift, and read the pair as an agreement of shapes, not of pixels. chl_image_is_olderB
Next: Part 6 — SST forecast versus observed. Back: Part 4. The chlorophyll layer is part of Fishare Pro; the layers and their coverage by region are listed on the offshore page, and the rules tagged above are on How we read SST.
Open the map and switch on CHL beside SST. The switching guide names the satellites that carry the chlorophyll.