Offshore forecast literacy · Field guide · 2026 edition
HOW TO READ SST AND HABITAT MAPS — FIND OFFSHORE FISH BEFORE YOU LEAVE THE RAMP
Most anglers plan a trip on the wind and the tide. Offshore, the fish follow something you can't see from the ramp: the structure of the water itself — temperature, edges, and current. Sea-surface temperature maps, the SST-gradient layer, and habitat-suitability heatmaps are how you read that structure before you burn a drop of fuel. Here is what each one shows, and how to actually use them.
Inshore, wind and tide are most of the answer. The moment you push wide for pelagics — tuna, marlin, mahi, kingfish — the fish stop caring about your local tide and start following the ocean's own structure: where the warm water bends, where a current edge concentrates bait, where the seafloor drops away. None of it is visible from the boat. All of it is on a map.
The three layers below — sea-surface temperature, the SST-gradient, and a habitat-suitability index — don't tell you where the fish are. They tell you where the conditions are right, which turns a huge empty ocean into a handful of high-odds zones. That is the whole game offshore: not searching everywhere, but knowing the few places worth searching.
Fish are cold-blooded. Their metabolism — and the metabolism of everything they eat — is set by the water temperature. Every species has a band it prefers and will actively move to find. Push outside that band and the fish thin out; sit inside it and you are at least in the game.
So the first question offshore is not "where are the fish." It is "where is the water my target species wants?" A sea-surface-temperature map answers exactly that — it is the dial you turn first. Different species want different water: a striped marlin or yellowfin will hunt warmer blue water than a southern bluefin holding in a cooler band. Set the species in your head before you ever open the map.
SST maps — read the edges, not the average
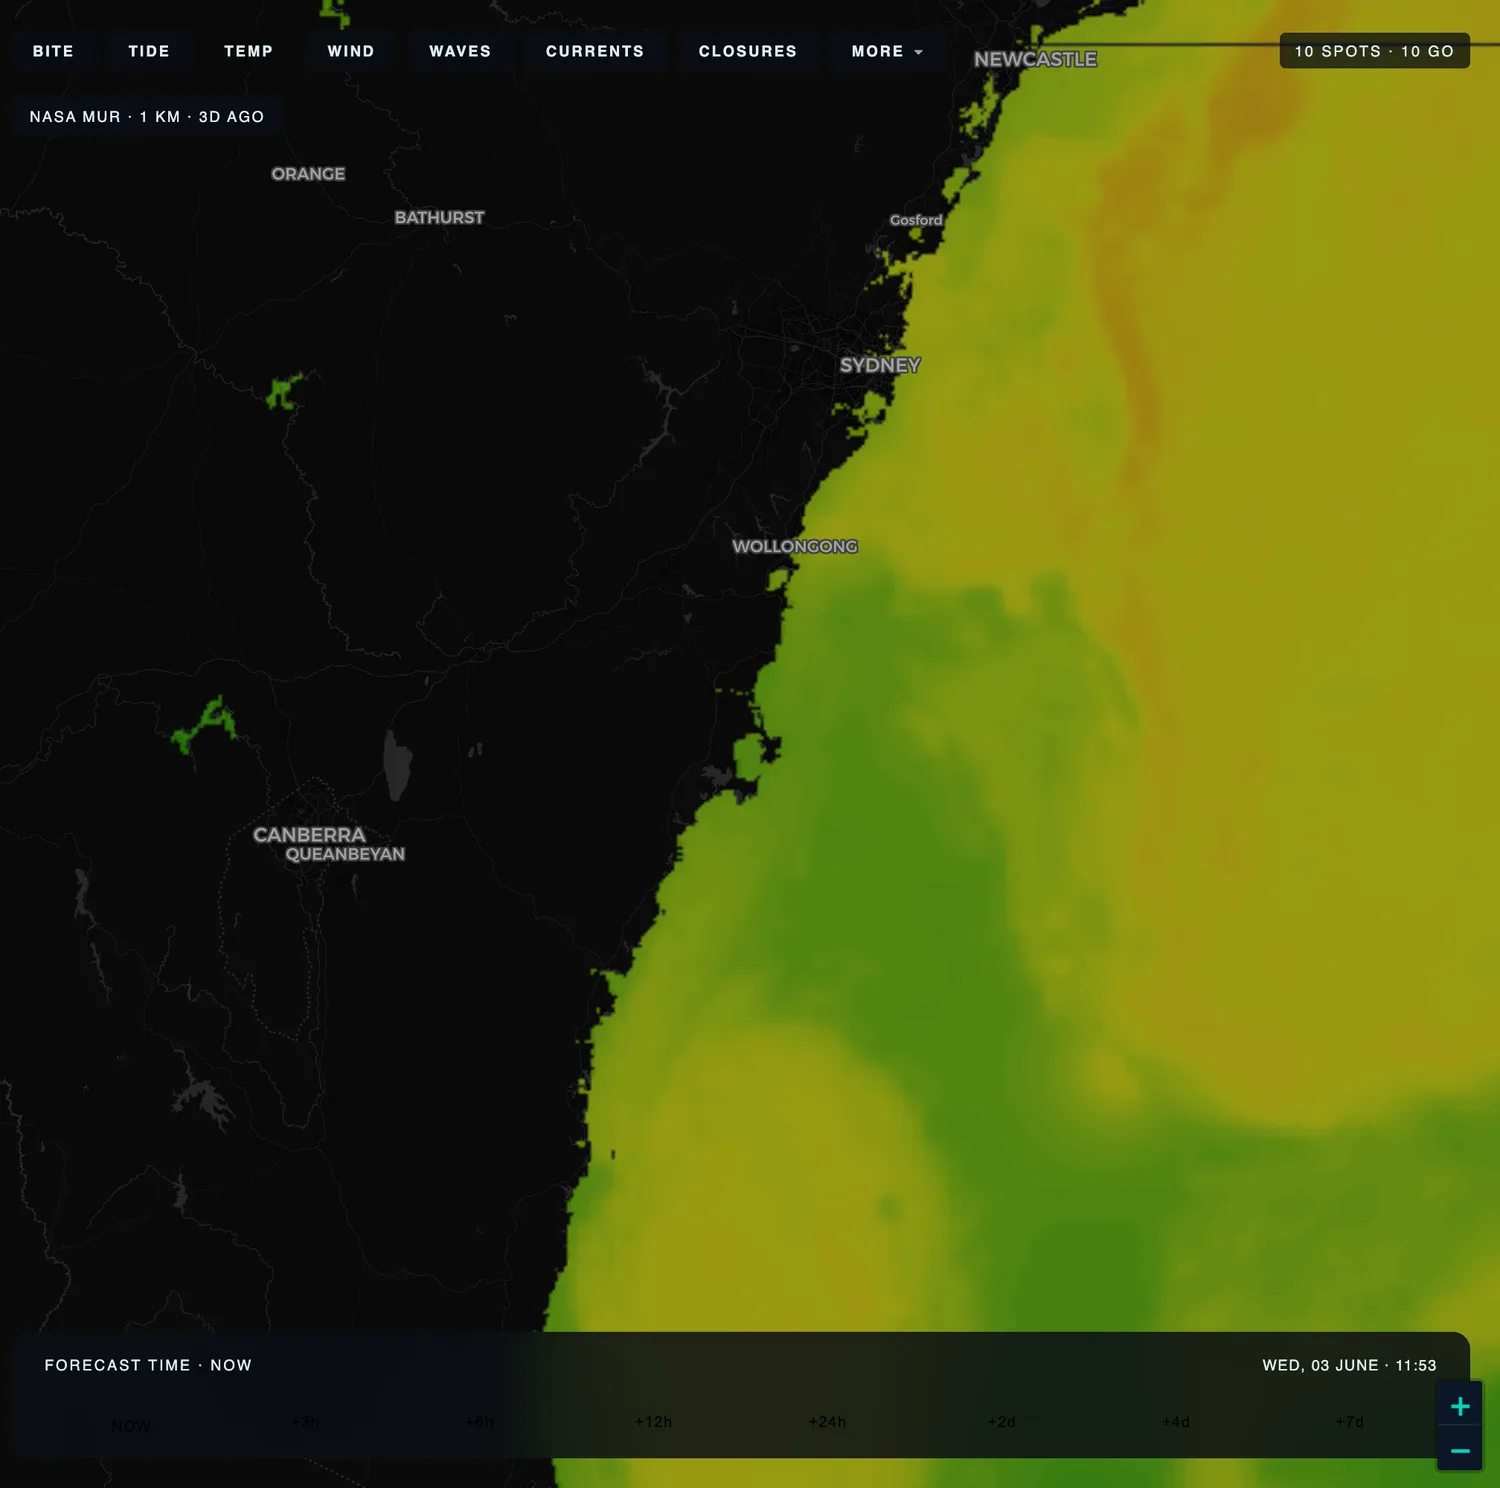
Fishare's SST overlay off the NSW coast (NASA MUR, 1 km). The warm EAC tongue runs south against cooler inshore water — the seam between them is the edge to fish.
A sea-surface-temperature (SST) map colours the ocean by how warm the surface is, usually built from satellite infrared and microwave sensors and refreshed daily. The rookie move is to hunt for one magic number. The number gets you into the right region — but what matters more is the edge.
A temperature break — a "front" — is where two bodies of water at different temperatures meet. Even a 1–2°C change over a short distance is enough. These edges are where the action concentrates, for three reasons:
Bait piles up. Water masses converging at a front physically herd plankton and baitfish into a narrow band — a buffet line that runs for miles along the seam.
The water changes character. One side is often warmer, bluer and clearer; the other cooler, greener and more nutrient-rich. That colour change is a visible seam predators patrol.
Predators know it. Tuna and billfish don't wander random open water — they run the edges, picking off concentrated bait. Decades of offshore lore — "find the temperature break, find the fish" — is this one fact.
What a front looks like on the map
On a raw SST map a front shows as a place where the colour bands crowd together — the contours go from widely spaced to tightly packed. Widely spaced colours mean a gentle, featureless gradient; tightly packed colours mean a sharp edge. Find your species' temperature band first, then look for the break inside or beside it. The seam is the spot, not the middle of a uniform patch.
The one-line version
The temperature number puts you in the area. The temperature edge holds the fish. Fish the seam between two water masses — not the middle of a big, even patch.
The SST-gradient layer
Eyeballing breaks off a raw temperature map is hard — gentle colour shifts hide sharp seams, and a 1°C edge can be invisible on a scale that runs across 10°C of ocean. An SST-gradient layer does the maths for you. Instead of colouring by temperature, it colours by how fast the temperature is changing over distance.
The result reads like a contour map of edges. Strong fronts light up as bright, sharp lines; featureless water stays dark. It turns "somewhere around here it gets cooler" into a drawn line you can set a waypoint on. When captains talk about working "the break," the gradient layer is the break, drawn for you. It is the single most useful overlay for finding where to start.
HSI maps — conditions, by species
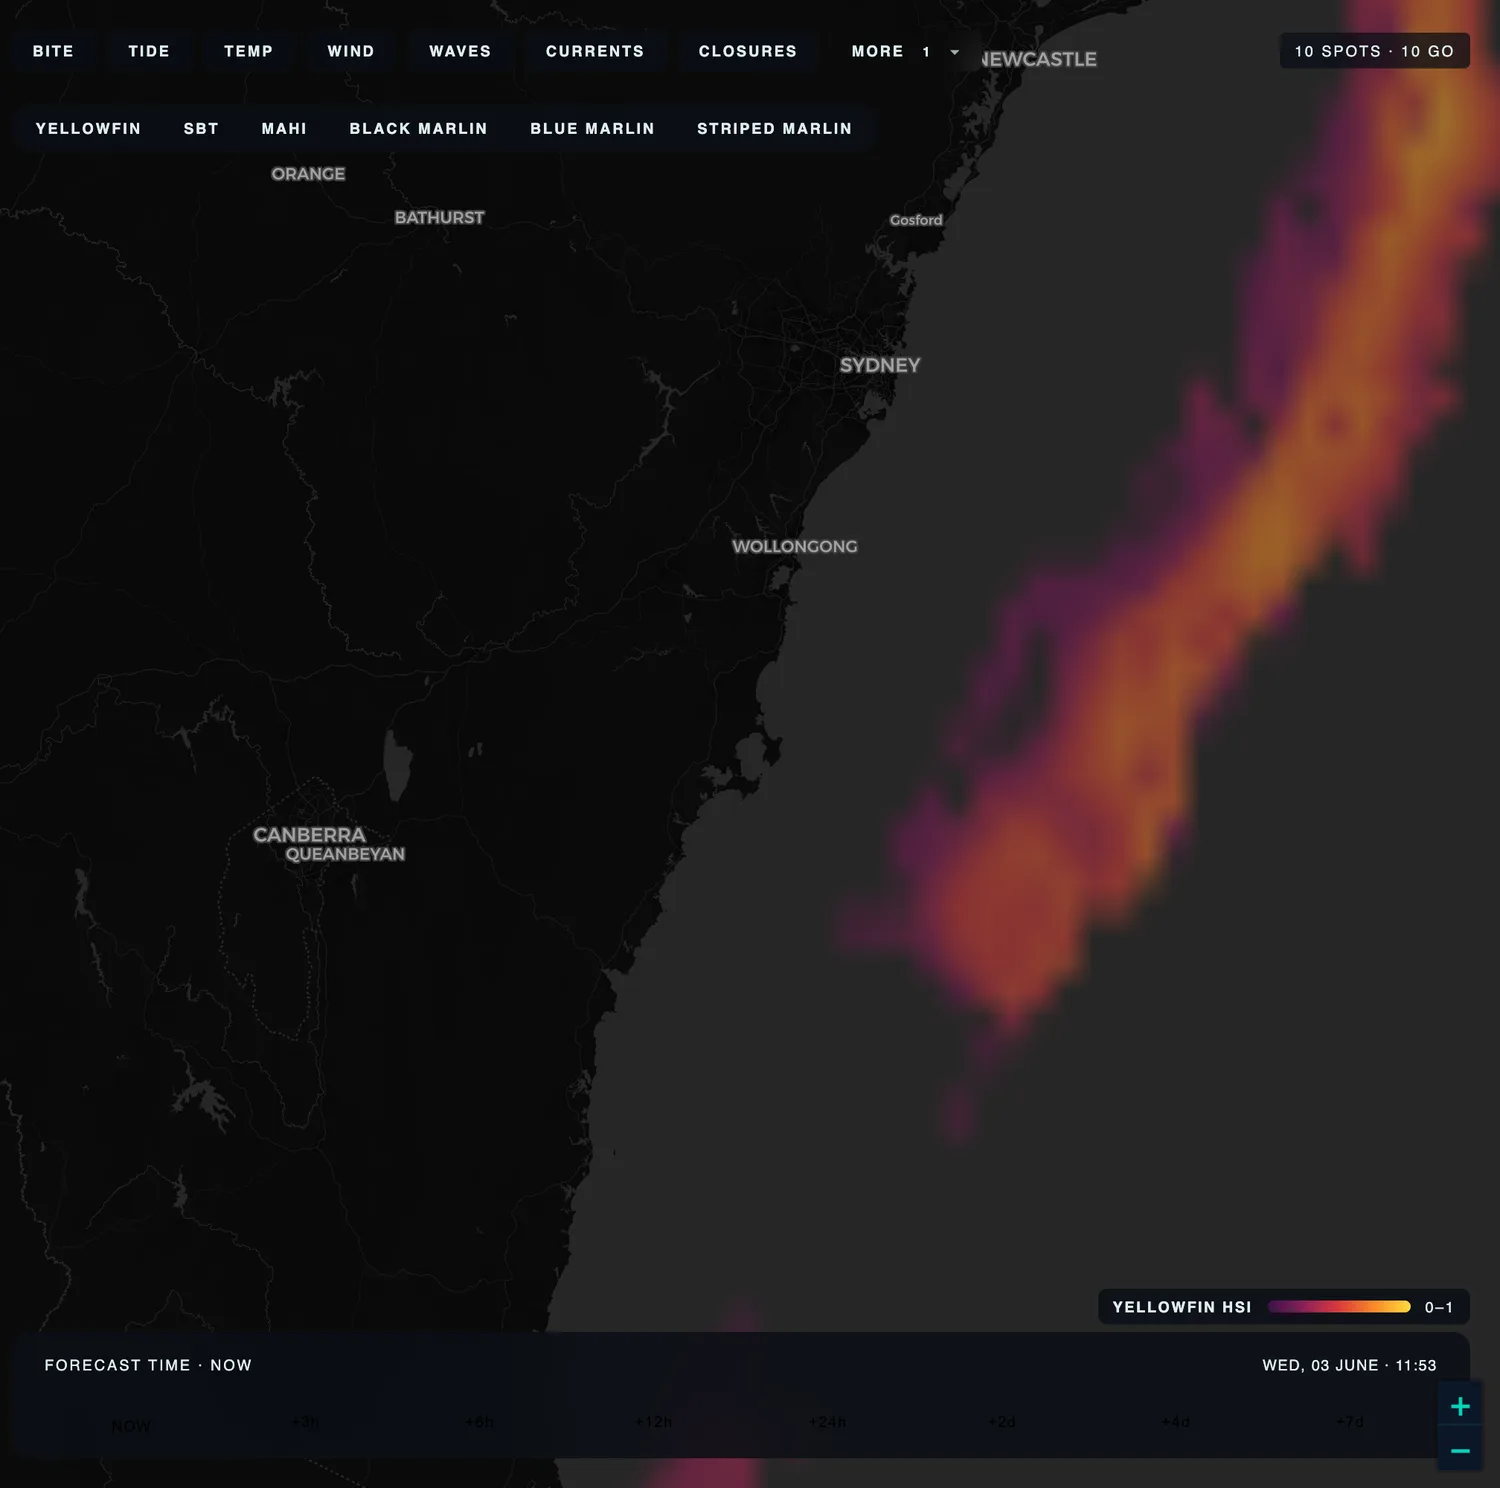
The habitat (HSI) heatmap for yellowfin tuna. Hotspots (orange/yellow) are where temperature, fronts, current edges and seafloor structure line up — pick a different species and the map re-scores.
A temperature break is one ingredient. A Habitat Suitability Index (HSI) map combines several into a single answer. It rolls together the signals that decide whether a patch of ocean is worth fishing today, and scores each cell for the species you pick:
Temperature
Is the water inside the species' preferred thermal band right now?
SST gradient
Is there a front — a sharp temperature edge — running through the cell?
Current & eddies
Are there spinning current edges where bait concentrates and water upwells?
Bathymetry
Is there a shelf break, canyon or drop-off forcing nutrient-rich water up?
Where those ingredients stack up in the same place, you get a hotspot. An HSI map is essentially "where I would look first, for this species, today" — distilled from layers that are tedious to read one at a time. Two things to keep straight:
It is not a fish finder. It shows where the conditions are right, not where the fish definitely are. Think "where I'd look first," not "X marks the spot."
It is species-specific. Bluefin, marlin and mahi want different things. A great cell for one can be a dead cell for another — always set the species before you read the map.
Reading them together — a pre-trip workflow
The layers are most powerful in sequence. The routine that turns them into a run plan:
1. Pick your target and set the map to that species. Everything downstream depends on it.
2. Open SST and find water sitting in your species' temperature band. That is your search region.
3. Switch on the gradient or HSI and, inside that band, find the strongest edges and the hotspots where signals overlap.
4. Cross-reference structure. Does a hotspot sit on a shelf break, canyon edge, seamount or reef? Structure + a front + the right temperature is the trifecta — the seafloor anchors the bait that the front concentrates.
5. Check the day before, not a week out. Offshore water moves. Fronts and eddies drift daily, so the map you trust is the most recent one. A hotspot that was 20 miles offshore on Monday can be 30 miles south by Saturday.
A worked read — an EAC edge off Sydney
A concrete example. It's a Friday in late autumn and the plan is a wide-water run off Sydney for a yellowfin tuna or a stray striped marlin still hanging on the warm water. The East Australian Current — the warm western boundary current that runs down Australia's east coast and spins off warm-core eddies as it goes — is the whole story here.
Step 1 — SST: where is the warm water
The SST map shows the EAC pushing a tongue of warm water south, with a cooler counter-current inshore of it. The yellowfin want the warm side. That tongue is the search region — but the tongue is broad, and the middle of it is not the answer.
Step 2 — gradient: find the seam
Flip to the SST-gradient layer and the edge of that warm tongue lights up as a bright, curving line — the convergence between the warm EAC water and the cooler water inshore. That seam, not the warm patch behind it, is where the bait stacks and the temperature edge runs. A warm-core eddy that has pinched off and is spinning to the south shows its own ring of strong gradient around the edge.
Step 3 — HSI: where it all stacks
Switch to the habitat layer with yellowfin selected. The hotspots glow where the warm band, the strong front, and the current edge all coincide — typically along that EAC seam and around the spinning eddy edge, not in the dead centre of either. Two or three cells stand out.
Step 4 — structure and timing
Cross-reference the chart: the best of those hotspots sits near the shelf break, where the bottom drops from the continental shelf into deep water and pushes nutrient-rich water up. That is the cell to run to. Check the map again Saturday morning before you leave — if the eddy has drifted, the waypoint moves with it.
The verdict
The maps don't promise a fish on the deck. They turn "somewhere out wide" into a specific seam on the shelf break worth a 30-nautical-mile run — and tell you to re-check the morning of, because the water you're chasing is moving while you sleep.
The honest part
These are probability maps, not promises. They narrow a huge ocean down to a handful of high-odds zones — a massive edge over running blind — but they do not guarantee a fish. Conditions can be perfect and the fish simply not there, or there and not feeding.
The best anglers treat the maps as a starting hypothesis and then calibrate against their own logbook. Note where the map was right and where it was off for your waters — your local species, your season, your coast — and your read gets sharper every trip. A habitat model calibrated mostly on one region's catch data is a strong starting point everywhere, but it learns your patch only as catches from your patch come in. Treat a hotspot as the best place to start looking, never as a mark on the fish.
What Fishare puts on the map
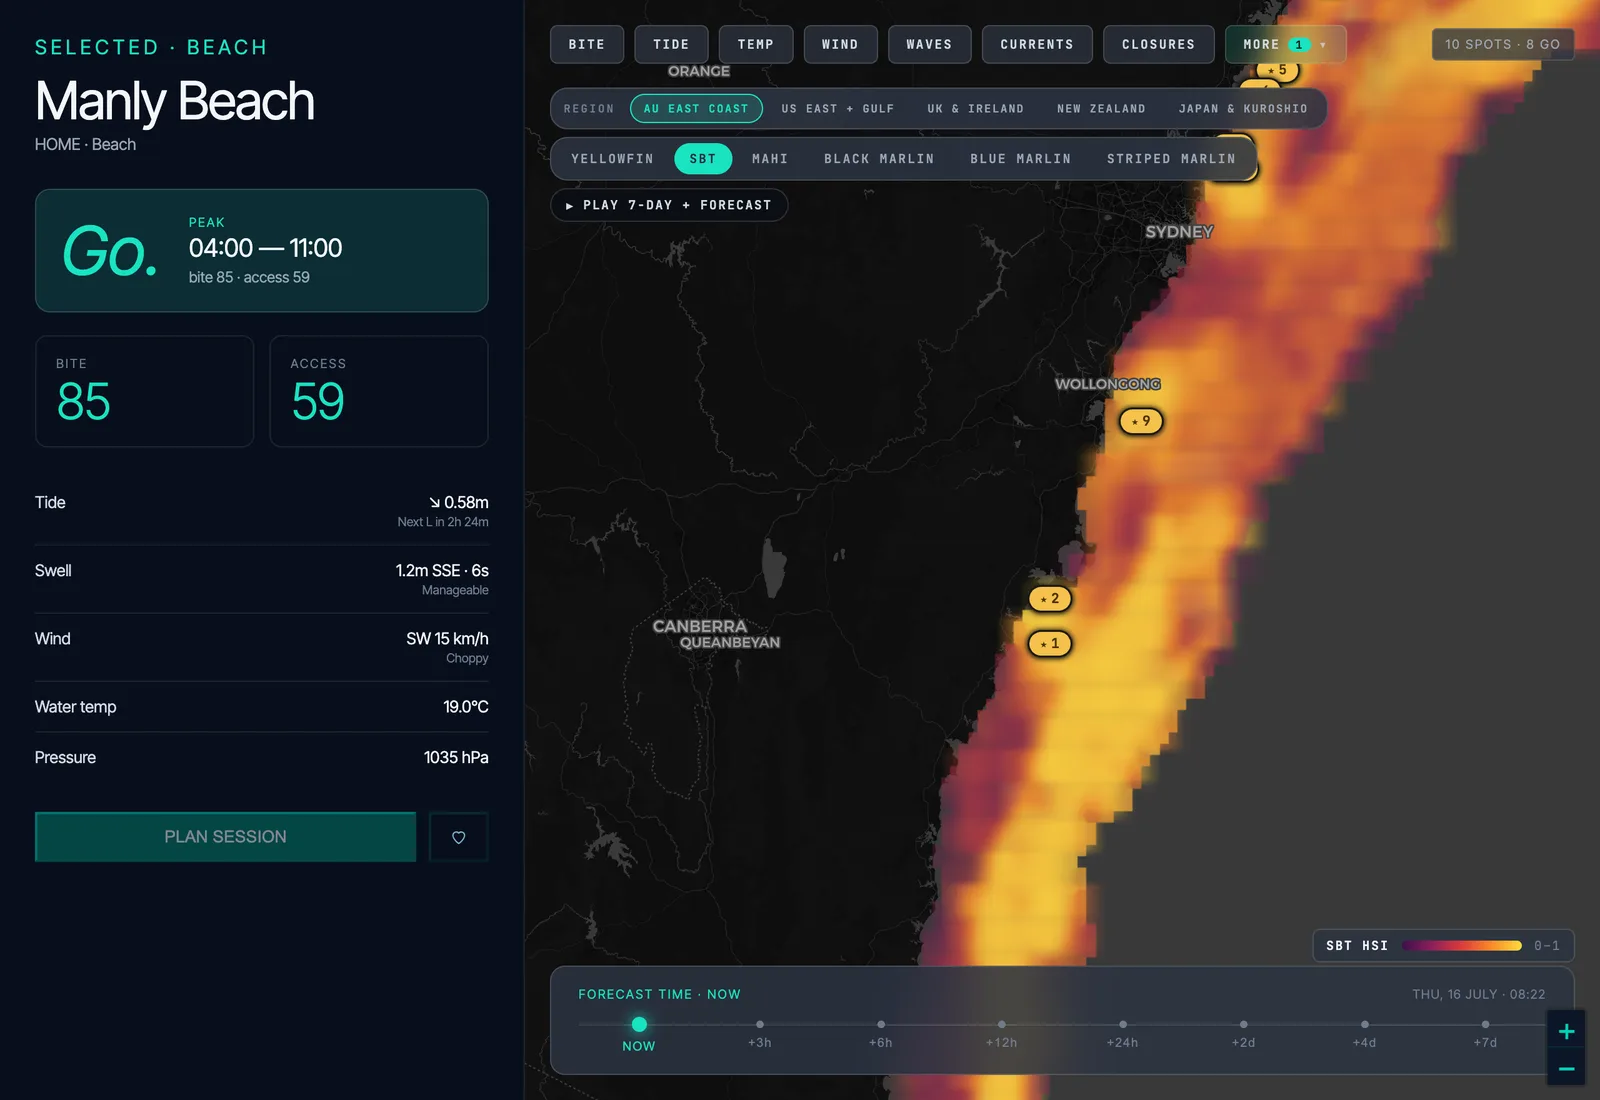
Fishare pulls all of these layers onto one map — sea-surface temperature, the SST-gradient, ocean currents, bathymetry, and a species-by-species habitat (HSI) overlay — so you don't tab-hop between four satellite-imagery sites to read one piece of water. A 7-day playback animates the habitat heatmap backward from today — hit play, pause, or scrub the bar to watch the warm water and thermal fronts move over the week, so you can see which way the good water is trending. A 14-day time slider lets you plan further ahead and watch a front set up before you commit to a launch day. The offshore habitat layer covers Australia's east coast and the US East Coast & Gulf, with Atlantic bluefin habitat now live for the UK and Ireland.
The offshore map mid-playback — pick a region and species, hit PLAY 7-DAY + FORECAST and watch the habitat bands move across the week.
See it on the live map
Everything above is live in Fishare — SST, the gradient layer and the habitat heatmap by species, free to browse, no account needed. Pick your species, find the edge, and run to the hotspot.
Olli-Mikael Vaittinen has fished his whole life. Fifteen years of fly fishing, guiding seasons on Norway's Lakselva — his favourite Atlantic salmon river — and a blue marlin landed in Vava'u, Tonga. Founder of Fishare — the app that puts the data behind the decisions every angler makes on the water.
Fishare puts SST, the gradient layer, currents, bathymetry and a species-by-species habitat heatmap on one map, with a 14-day slider so you can watch a front set up before you run. Free to view, no account needed to browse.
Finding Bluefin in UK Waters — the same SST-and-habitat read applied to Atlantic bluefin in the Celtic Sea and Western Approaches, with the 2026 catch-and-release season.
Sydney Summer Pelagic Playbook — the warm-water season this guide's worked example is built for: kingfish, mahi, marlin and yellowfin on the EAC.
Open the Fishare map — pan the offshore overlay and it shows that water's species and conditions.
Sources cited
The data layers described in this guide are built from public oceanographic products. Sea-surface temperature and chlorophyll come from satellite remote-sensing programmes; bathymetry from global compilations; waves, currents and marine SST from the Open-Meteo marine API. Species thermal preferences and the "fish the front" principle are well established in fisheries oceanography; local calibration improves as catches are logged.
Last verified: 2026-06-18. SST, gradient and habitat layers are model and remote-sensing products and carry inherent uncertainty. A habitat-suitability map shows where conditions are favourable, not where fish are present — treat a hotspot as the best place to start looking, and calibrate it against your own catch log.