The others sell you yesterday’s water. HSI reads it and tells you where to run — today, and every day this week.
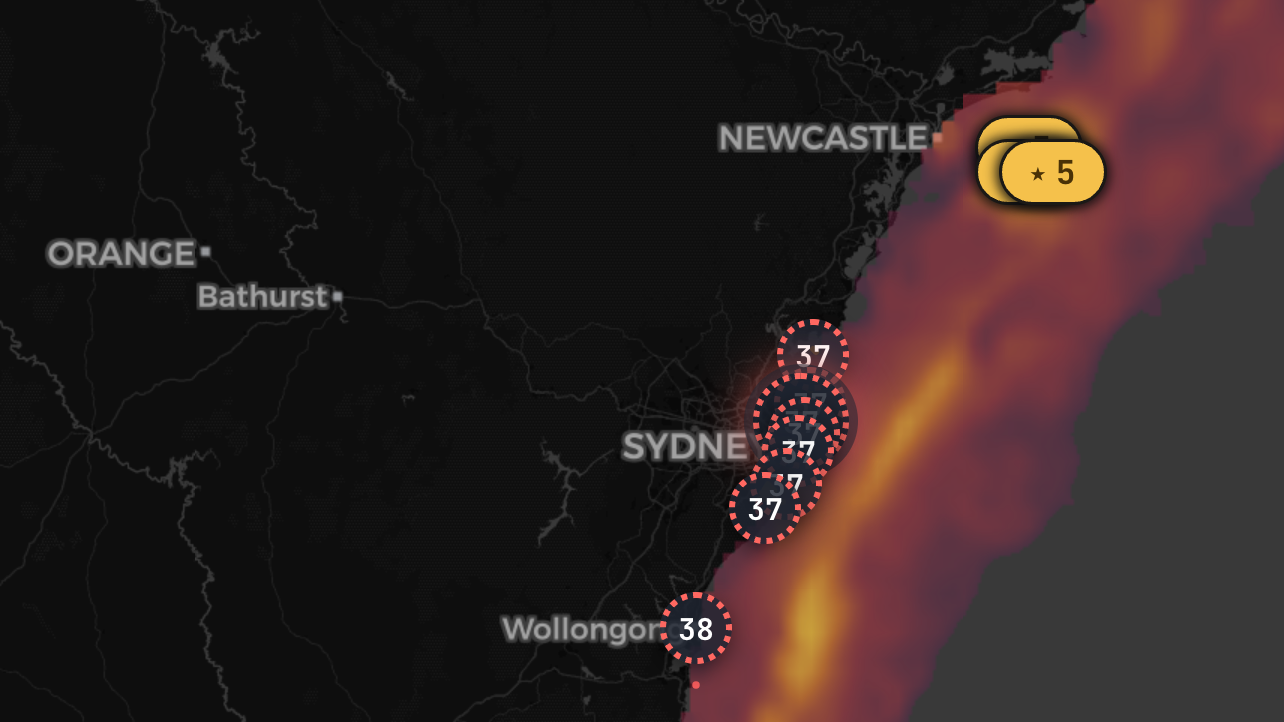
A real model layered on top of the ocean — telling you where the marlin, tuna, mahi mahi and the rest of the pelagics actually are. Satellite-fed, updated daily, 9 species and counting — live across AU East Coast, US East + Gulf, US West Coast, AU West Coast, Hawaii, UK & Ireland, New Zealand and Japan & Kuroshio.
For years, finding offshore fish meant subscribing to raw satellite imagery, learning to read the sea-surface temperature charts yourself, learning to spot the productive water, learning to read the spinning ocean structure, and then doing the interpretation in your head before you steamed out. HSI does the interpretation for you.
The model looks at five things, all at once, every day. Each one tells you something different about where the fish should be. The score is what you actually want to know: given everything I can see, how good does this patch of water look right now, for the species I care about?
Five layers, one score. Each layer tells the model something different about the ocean — together they tell it where the fish should be.
Pelagic species hunt along the seams where warm water meets cold. The model checks satellite SST every day, finds the warm-cold edges automatically, and tells you how close each spot is to one. You don't need to learn to read a thermal-gradient chart — it's already in the score. Hit play and watch the last 7 days animate — see the warm water move, the fronts shift, which way the edges are trending.
The big swirling features that pelagics actively track — warm-core and cold-core spinning bodies of water that concentrate baitfish along their edges. The model knows where they are, which way they spin, and which species favour which type. Yellowfin and southern bluefin prefer one kind. Black marlin and mahi mahi prefer the other.
Where the green stuff is, the baitfish are. Where the baitfish are, the predators follow. The model factors in productivity-rich water bodies and the boundaries where they meet clearer blue water — that's where the bait gets concentrated.
The model knows where the seamounts, ledges, drop-offs and submarine canyons are. So it basically knows the contours of the seabed and finds the good fishing structure for you automatically — you don't have to scroll through a chart looking for the 200m line.
Where the surface flow is heading and, more importantly, where the shear lines set up — those long lines where current speed changes and bait gets pushed up against the boundary. Same principle as the temperature edges, just for water movement.
Each species has its own thermal sweet spot, eddy affinity and depth preference baked in. Pick a species, see its heatmap.
More species are rolling out as we build out their thermal and structure profiles. If you fish a species that's not on this list and want it added, drop a note via the chat in the app.
The list above opens with "pay for a satellite imagery subscription" — so here is the honest side-by-side against the ones people actually hold. Each page names their real pricing, cites where it came from, and says plainly where they beat us.
There's a code field at checkout. Codes go to club partners, creators and competition winners — if you've got one, it applies at checkout and HSI is free for as long as the arrangement runs.
Then HSI is already yours, free for life — a thank-you for being there early. The app checks your signup date and unlocks it automatically; there's nothing to do and nothing to pay.
It's a 0-to-100 score for how good the conditions look at any patch of water, for the species you've picked. Higher score = more of the things that species likes (right temperature, near a productive edge, good structure underneath, baitfish around). It's not a guarantee — fish are still fish — but it's the best read we can give you of where to actually go.
9 across the 8 live regions, and the selector adapts to the water you're looking at. On Australia's east coast: yellowfin tuna, southern bluefin tuna, mahi mahi, black marlin, blue marlin, striped marlin. On Australia's west coast, Exmouth to the Capes: yellowfin tuna, mahi mahi, southern bluefin tuna, black marlin, blue marlin, striped marlin, wahoo. On the US East Coast & Gulf: yellowfin tuna, atlantic bluefin tuna, mahi mahi, wahoo, blue marlin, white marlin. On the US West Coast: yellowfin tuna, mahi mahi, striped marlin — a deliberately short, warm-water-only list; albacore, the bread-and-butter target from Morro Bay north, has no model here, so if that is what you chase the honest pitch on this coast is the ocean layers rather than the heatmap. In Hawaii: blue marlin, yellowfin tuna, mahi mahi, wahoo, striped marlin. In UK & Ireland waters: Atlantic bluefin tuna — the species the SW England, Celtic Sea and North Sea summer run is built on. In New Zealand: striped marlin, yellowfin tuna, southern bluefin tuna, mahi mahi, blue marlin. In Japan & the Kuroshio: striped marlin, yellowfin tuna, mahi mahi, blue marlin, black marlin. More species roll out as we build and review their thermal and structure profiles.
It's a habitat model, not a fish finder — it reads the conditions, not the fish. Some days it's right and some days the fish do their own thing, because that's the nature of the ocean. Treat it as a way to narrow a big blue map down to the water worth burning fuel on, not as a promise. We don't publish an accuracy number, because we'd rather publish none than one you can't check.
8 regions are live today: AU East Coast, US East + Gulf, US West Coast, AU West Coast, Hawaii, UK & Ireland, New Zealand and Japan & Kuroshio. The US East Coast & Gulf went live in May 2026 (Atlantic bluefin, white marlin, wahoo); the UK & Ireland followed in June 2026 with Atlantic bluefin tuna — the SW England, Celtic Sea and the resurgent North Sea summer run; New Zealand and Japan/Kuroshio run the same warm-pelagic set as Australia. The map picks the region from wherever you're looking. The upstream satellite data is global, so the model can run anywhere — what gates a region is the per-species profiling and the daily bake, which is why regions arrive one at a time rather than all at once. The US West Coast and Hawaii joined in August 2026 — Hawaii on the full warm-pelagic set (Kona blue marlin, ahi, mahimahi, ono), the West Coast on a deliberately short warm-water list, because albacore has no model and we would rather say so than paint an empty map. Alaska and the Great Lakes are not covered and are not on the near list: both need a different data source and a species model that has nothing to do with shelf-break pelagics.
The trial starts with no card, so if you do nothing it simply ends after 7 days and you're never charged — no surprise bill. To keep HSI, add a card (or subscribe) before the trial ends and you continue at US$49.99/yr (or US$5.99/mo if you pick monthly). Cancel any time — no minimum term.
Just ask him. Friend codes get you HSI free for as long as you want it. There's a "Promo code" field at checkout. If you don't have a code yet, drop Olli a message via the chat in the app or any of the social links at the bottom of the page.
No. Anyone who signed up before July 17, 2026 gets HSI free for life as a thank-you for being there early. No action needed — the app checks your account creation date and unlocks HSI automatically.
Everything gated on the live map, not just HSI — one unlock covers the lot. The daily sea-surface temperature field with the warm-cold edges already found; chlorophyll-a; surface currents and the shear lines they set up; a modelled subsurface temperature ladder at SFC/25/50/100 m; seabed terrain in shaded relief, every ledge, pinnacle and drop-off at 30 m detail (Great Barrier Reef coast today); chart marks drawn from official charts — spot soundings, buoys, wrecks and hazards (US East Coast first, more coasts coming); and 7-day playback with a 2-day forecast across the same fields.
No — HSI is just one feature. The bite score, the live map, the spot pages, the tide model, the catch logging, the species and regulations content — all of that stays free, for everyone, forever. HSI is the layer on top for offshore anglers who want the satellite-fed habitat read.
We don't publish the recipe — the specific data sources, the exact model architecture, the validation numbers. The reasoning is simple: this took months of integration work to get right, and the offshore-intelligence incumbents that we're catching up with deliberately don't publish theirs either. We'd rather you trust the score on the merits than reverse-engineer the inputs.
What we will say: the model is multi-input, and the inputs are all real upstream measurements — satellite sea-surface temperature and chlorophyll, altimetry-derived currents and eddy structure, modelled subsurface temperature, and seabed bathymetry — combined with per-species habitat preferences drawn from the published literature. No Solunar-style 1926 lookups anywhere in it.
What we will not say is how well it scores. We are rebuilding the evidence base for the forecast side of the product from the ground up, on data whose provenance we can put in front of anyone who asks, and until that is done we would rather publish no accuracy figure than one we cannot fully stand behind. The score is decision support. It is not a promise, and it is sometimes wrong.

Olli-Mikael Vaittinen has fished his whole life. Fifteen years of fly fishing, guiding seasons on Norway's Lakselva — his favourite Atlantic salmon river — and a blue marlin landed in Vava'u, Tonga. Founder of Fishare — the app that puts the data behind the decisions every angler makes on the water.
Fishare tracks your home spots and pings you when the next 3-hour peak window opens. Log catches and blanks to teach the model your local patterns. The forecast, saved spots and catch log stay free, forever.
Open Fishare