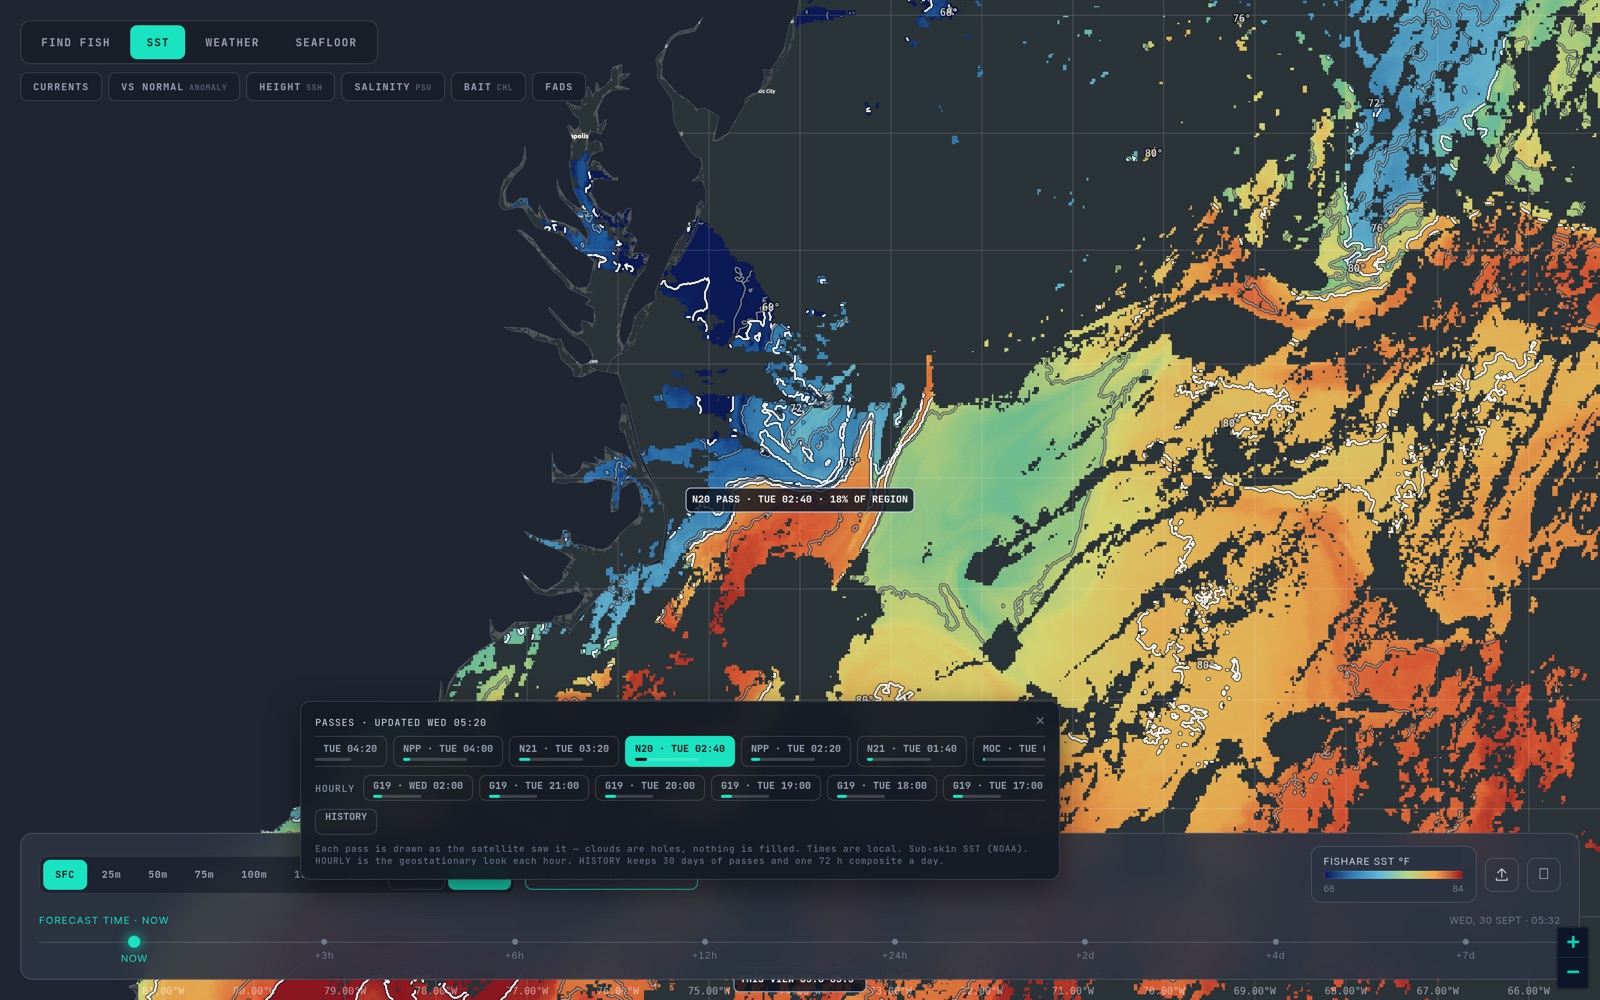
A pass is one satellite looking down once. It is the least processed picture of the sea you can get, and the one most anglers never see, because most charts hand you a daily average instead.
Part 1 of six. Each tip ends with a tag such as sst_break_definitionA: the rule it rests on and that rule's confidence grade (A agency or peer-reviewed, B two or more practitioners agree, C one practitioner or anecdote, I a property of our own bake). Tap a tag to read the rule and its sources. Degrees F and miles, as on the US East map.
A pass is one overpass of one satellite. Fishare draws every pass of the last 72 hours, each at 0.02 degrees (about two kilometres a pixel) with cloud left as holes, and checks for new passes every hour. The strip lists them newest first with the satellite, the local time and how much of the region was clear.
Here is how to read one, in the order that stops you reading it wrong.
1. Read the clear fraction before the colours
Infrared cannot see through cloud, so a pass is only as useful as the water it actually saw. A pass that is 15 percent clear over your canyon is a postcard; one that is 70 percent clear is a chart. The dark holes are not cold water. They are nothing, and a good chart leaves them that way instead of painting them in. cloud_hole_is_missing_not_edgeI When the water you care about is mostly hole, the honest read is too cloudy to call, not flat. too_cloudy_to_callI
2. Read the time
The VIIRS satellites cross a coast near 1:30 in the afternoon and 1:30 in the morning, local time, so a coast usually gets several looks a day, each seeing a different slice of it. The time matters for two reasons. On a calm, sunny afternoon the top millimetre of the sea warms unevenly, and an afternoon pass can draw an edge that the night pass does not; the night pass is the cleaner one, and Part 4 is about that. hourly_morning_edgeA And a pass is a moment: an edge a day old has moved, so read the stamp before you read the line. pass_age_and_freshnessB
3. Read the range, not the colour
The ramp on a pass is stretched to the water in view, so the same red is a different temperature on a different day or at a different zoom. Tap the water and read the number, or set the range yourself with the RANGE control. A fixed ramp, the classic spectral one, is there if you want the same colours every day. Either way it is the numbers that count, and above all the step between them: the degrees on a break label are a property of the water, not of the palette. sst_break_definitionA sst_break_strength_scales_with_deltaB
4. Find where the colours crowd
Warm and cold water side by side do not blend smoothly; they meet at a line. On a pass that line is where the bands of colour pack close together. That is the break, and it is the thing you came for. Fishare finds it for you and labels it with the two temperatures on either side, for example 4.9° BREAK · 68.0 → 72.9°. It only draws a line where the water changes by at least 0.45 °C (about 0.8 °F) across the front, which is close to the trade's floor of half a degree; longliners look for a degree or more, and two or three degrees is a wall. sst_break_definitionA
5. Distrust anything that follows a cloud
The pixels beside a cloud are partly contaminated and read cold, which makes a fake edge that follows the cloud's outline. The break scan keeps five kilometres away from every hole for exactly this reason. If a line on your screen hugs a hole, it is the cloud, not the water. cloud_hole_is_missing_not_edgeI Where a pass is too cloudy to scan, the chart says too cloudy to scan for a break instead of guessing. too_cloudy_to_callI
6. Read two passes before you believe one
A single pass is a lead. The same edge on the next pass, hours later, is a trend. A break that has held for two or three days has had time to gather plankton, then bait, then the fish that follow; a fresh one has little on it yet. sst_break_persistence_three_daysB Part 3 shows how to line two passes up.
What a pass will not tell you
It sees the skin of the sea, the top fraction of a millimetre, not the water a lure runs through: the boat's transducer will often read half a degree to a degree off the chart, and more under a calm afternoon sun. Compare the step across the break, not the absolute number. skin_vs_boat_thermometerA It cannot see under cloud. And it is a picture of a moment: it says where the edge was when the satellite went over. pass_age_and_freshnessB
That is the whole skill: clear fraction, time, range, crowd, cloud, repeat. Everything else in this series is a way to check what the pass is telling you. None of it says where the fish are. It says where the water says to look. honest_hedge_languageI
Next: Part 2 — Breaks, and why fish sit on them. The overview of all the layers is in How to read SST and habitat maps, every region's newest pass is timestamped on the data status page, and the rule behind every tag on this page is set out on How we read SST.
Open the map and turn on SST, then PASSES. If you pay for satellite SST charts one region at a time today, the switching guide sets out what carries over and what does not.