Read the water
before you burn
the diesel.
The shelf, the canyons and the current lines, drawn for you: our own daily sea-surface temperature field with the breaks already found, eddies with the sea-surface-height structure around them, temperature at depth, and a per-species habitat score on top. One map instead of four tabs.
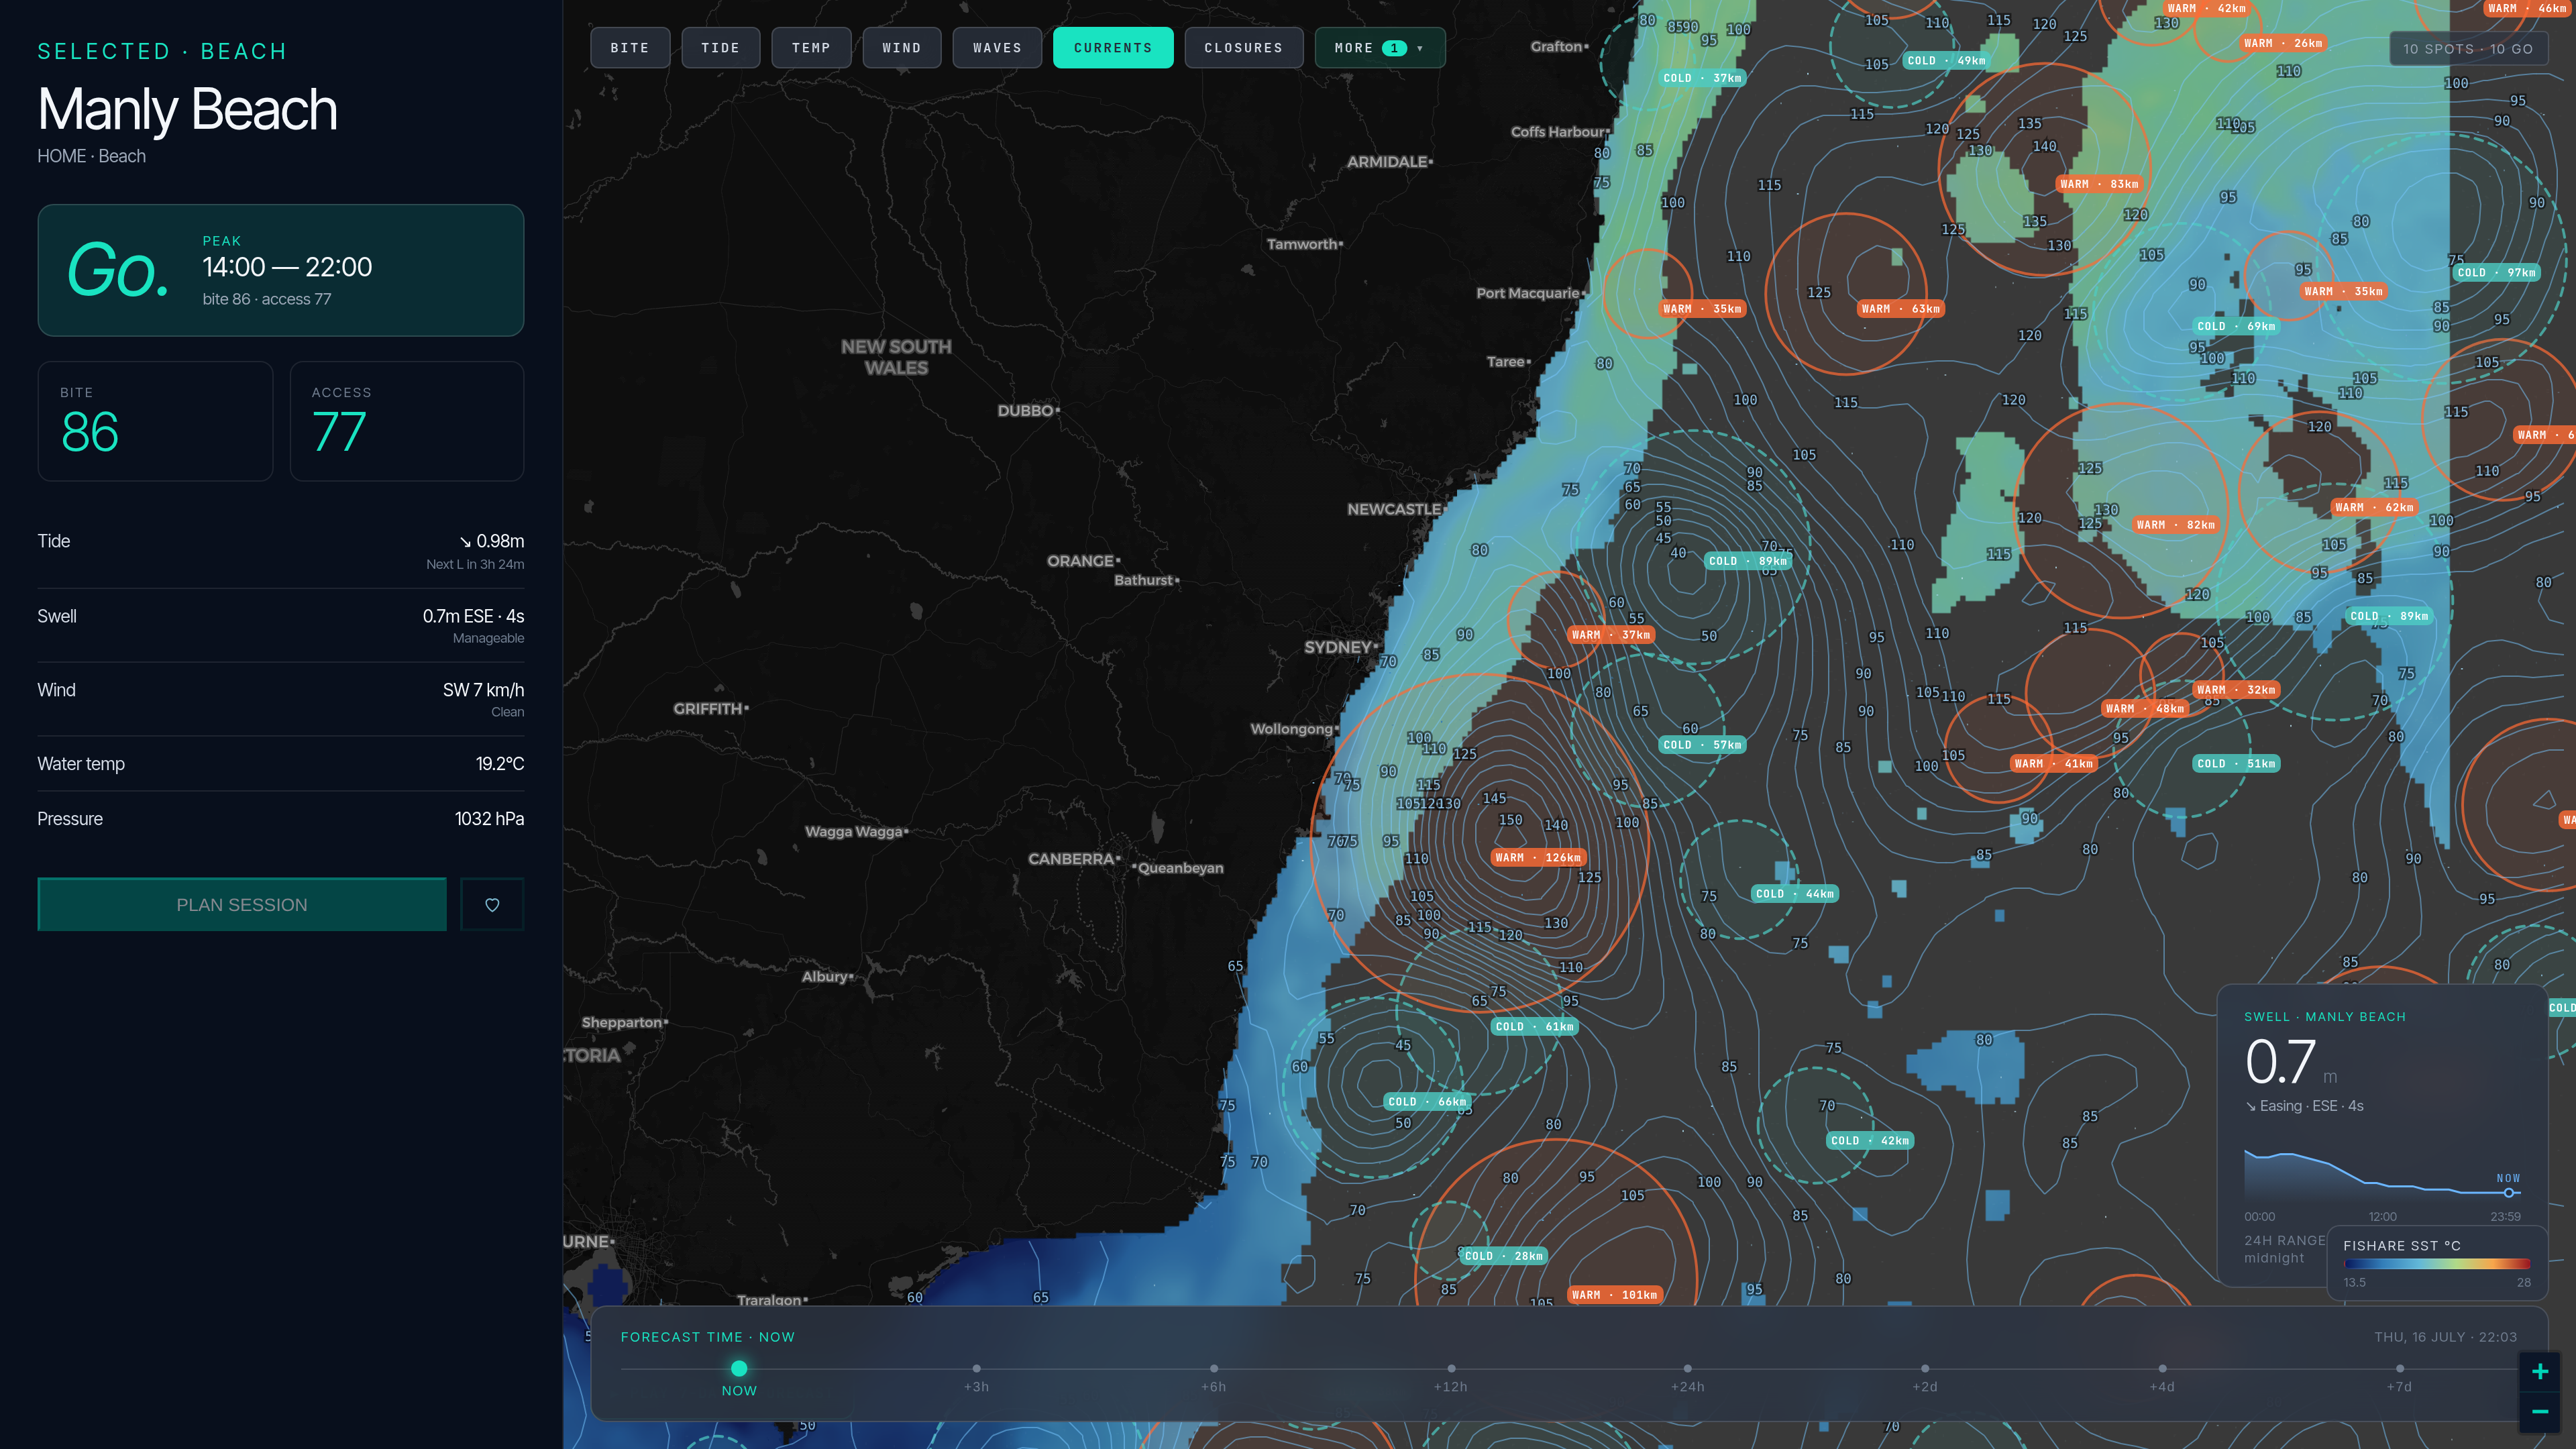
Eight layers. One decision.
Every layer here is on the same canvas, at the same time, on the same timeline — so the question stops being "what do these five charts mean together?" and becomes "is Saturday worth it?"
Our own SST field, with the edges already found
A daily gap-filled (cloud-free) satellite SST field at roughly 4 km, rendered as our own map rather than hidden inside a model. Isotherms in 1°C steps — 0.5°C on tight-range days — and automatic gradient detection that puts a °C-delta chip on the strongest fronts.
Tap anywhere and you read the actual grid value in °C. Not a guess off the colour scale.
AU east coast · US East Coast & GulfScrub back 7 days, forward 2
Play the last seven days of the same field and watch the break move, then run it forward through a two-day forecast. Where the edge is heading matters more than where it sat this morning.
Static composites can't show you that. A field that is complete every single day can.
Same coverage as the SST fieldEddies, with the sea-surface height around them
Warm-core and cold-core eddies drawn with their diameter on the badge, sea-surface-height contour loops labelled in centimetres, and surface-current vectors over the top. The spinning water that concentrates bait, shown as structure rather than as a colour wash.
AU east coast · NZTemperature at SFC / 25 / 50 / 100 m
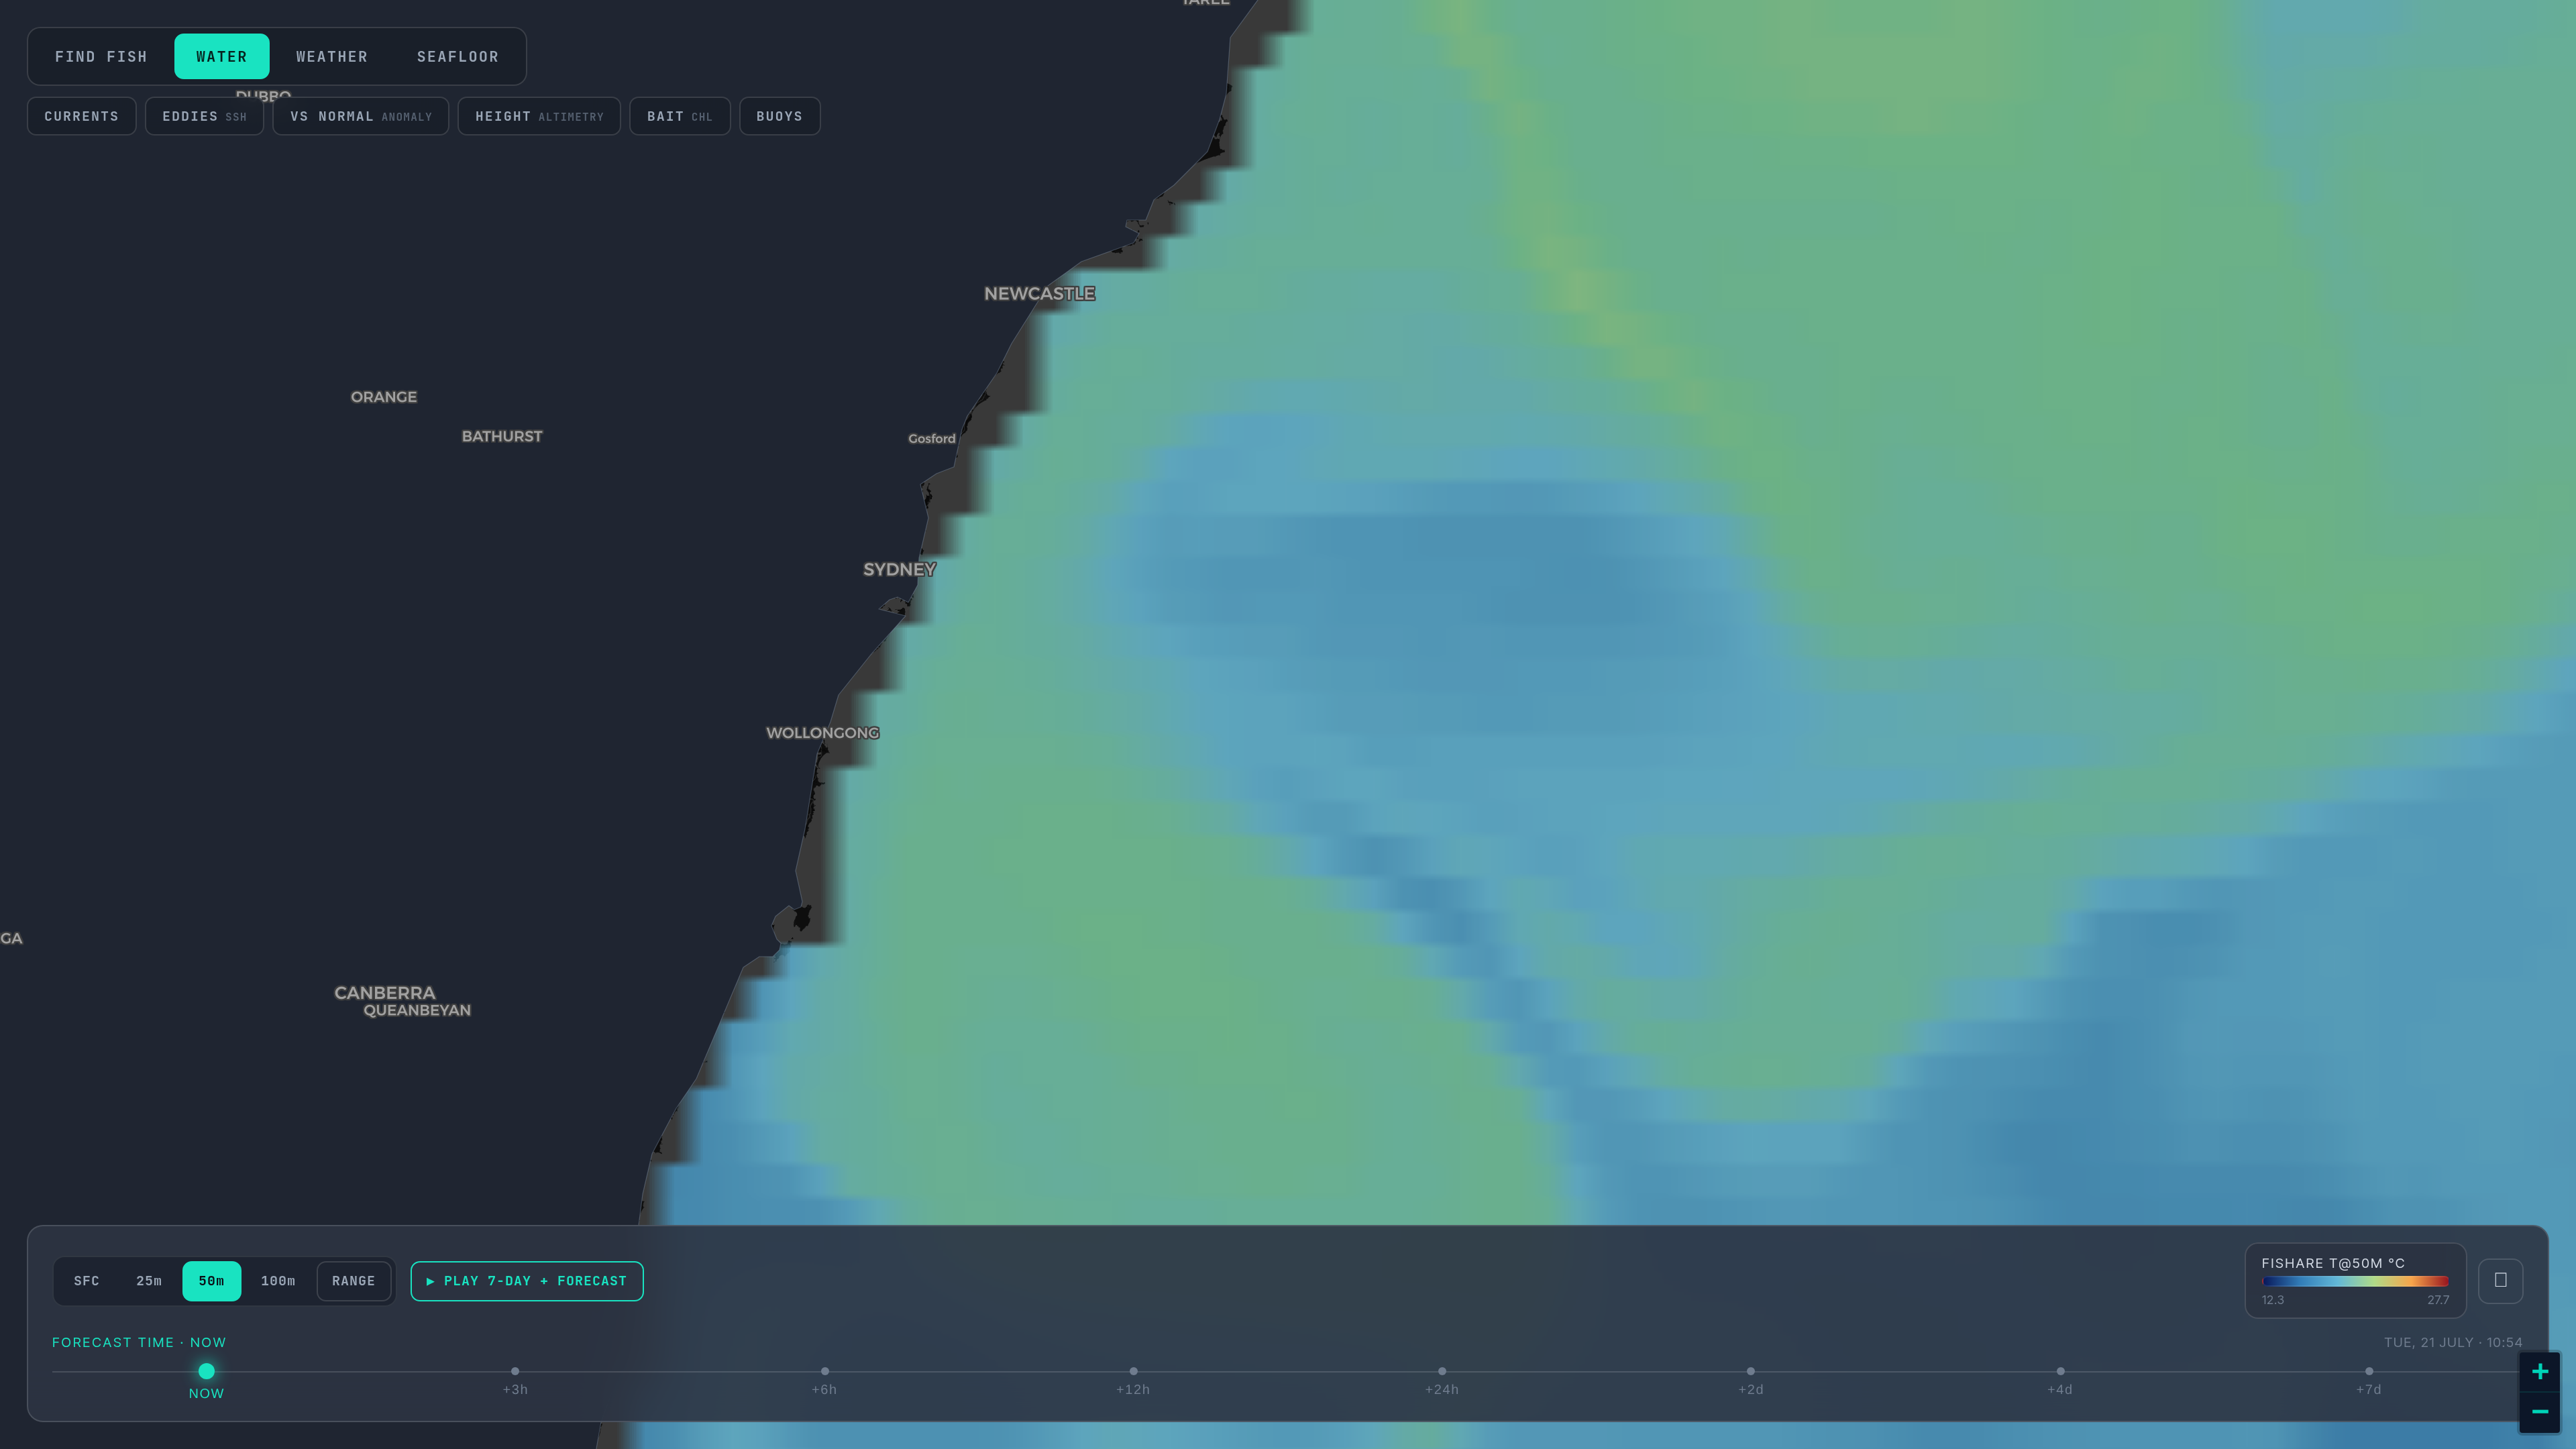
A surface break can be a sun-warmed lie. A break still there at 50 m is a real water-mass boundary. Switch depth and the whole field re-renders at that level, with the legend stamped T@50M °C so you always know what you're looking at.
Said plainly: this is model output (HYCOM-class), not something a satellite sensed. Nobody senses temperature below the surface from orbit — every subsurface product in this sport, ours included, is a model. We'd rather label it than let you assume otherwise.
Same coverage as the SST fieldChlorophyll-a and true-colour
Chlorophyll-a is its own layer, not a tint on something else — the green-water boundaries where bait gets concentrated against clearer blue. True-colour NASA VIIRS imagery at 250 m sits underneath it, daily, free.
Chlorophyll-a where the ocean layers runSeabed terrain in shaded relief
Every ledge, pinnacle and drop-off at 30 m detail, rendered as lit relief rather than contour lines — the structure that holds bait read as shape, not as a stack of numbered rings.
This is a different product from the free depth contours every user gets. Contours tell you the depth; the relief shows you the ground.
Great Barrier Reef coastChart marks drawn from official charts
Spot soundings, buoys, lights, wrecks and hazards, indexed straight off the official hydrographic charts and drawn on the same canvas as the water layers — so the obstruction and the temperature break are one map, not two apps.
US East Coast first, more coasts comingA per-species habitat score
HSI fuses SST and thermal fronts, eddies, chlorophyll, seabed structure and surface currents into one 0–100 score for the species you picked — fourteen of them, each with its own thermal window, eddy affinity and depth preference. The bright water is where the model says to look.
Underneath the map, the daily bite verdict comes from a multi-input model that reads tide, wind, swell, barometric pressure, sea temperature and moon phase, hour by hour.
AU east · US East Coast & Gulf · UK & Ireland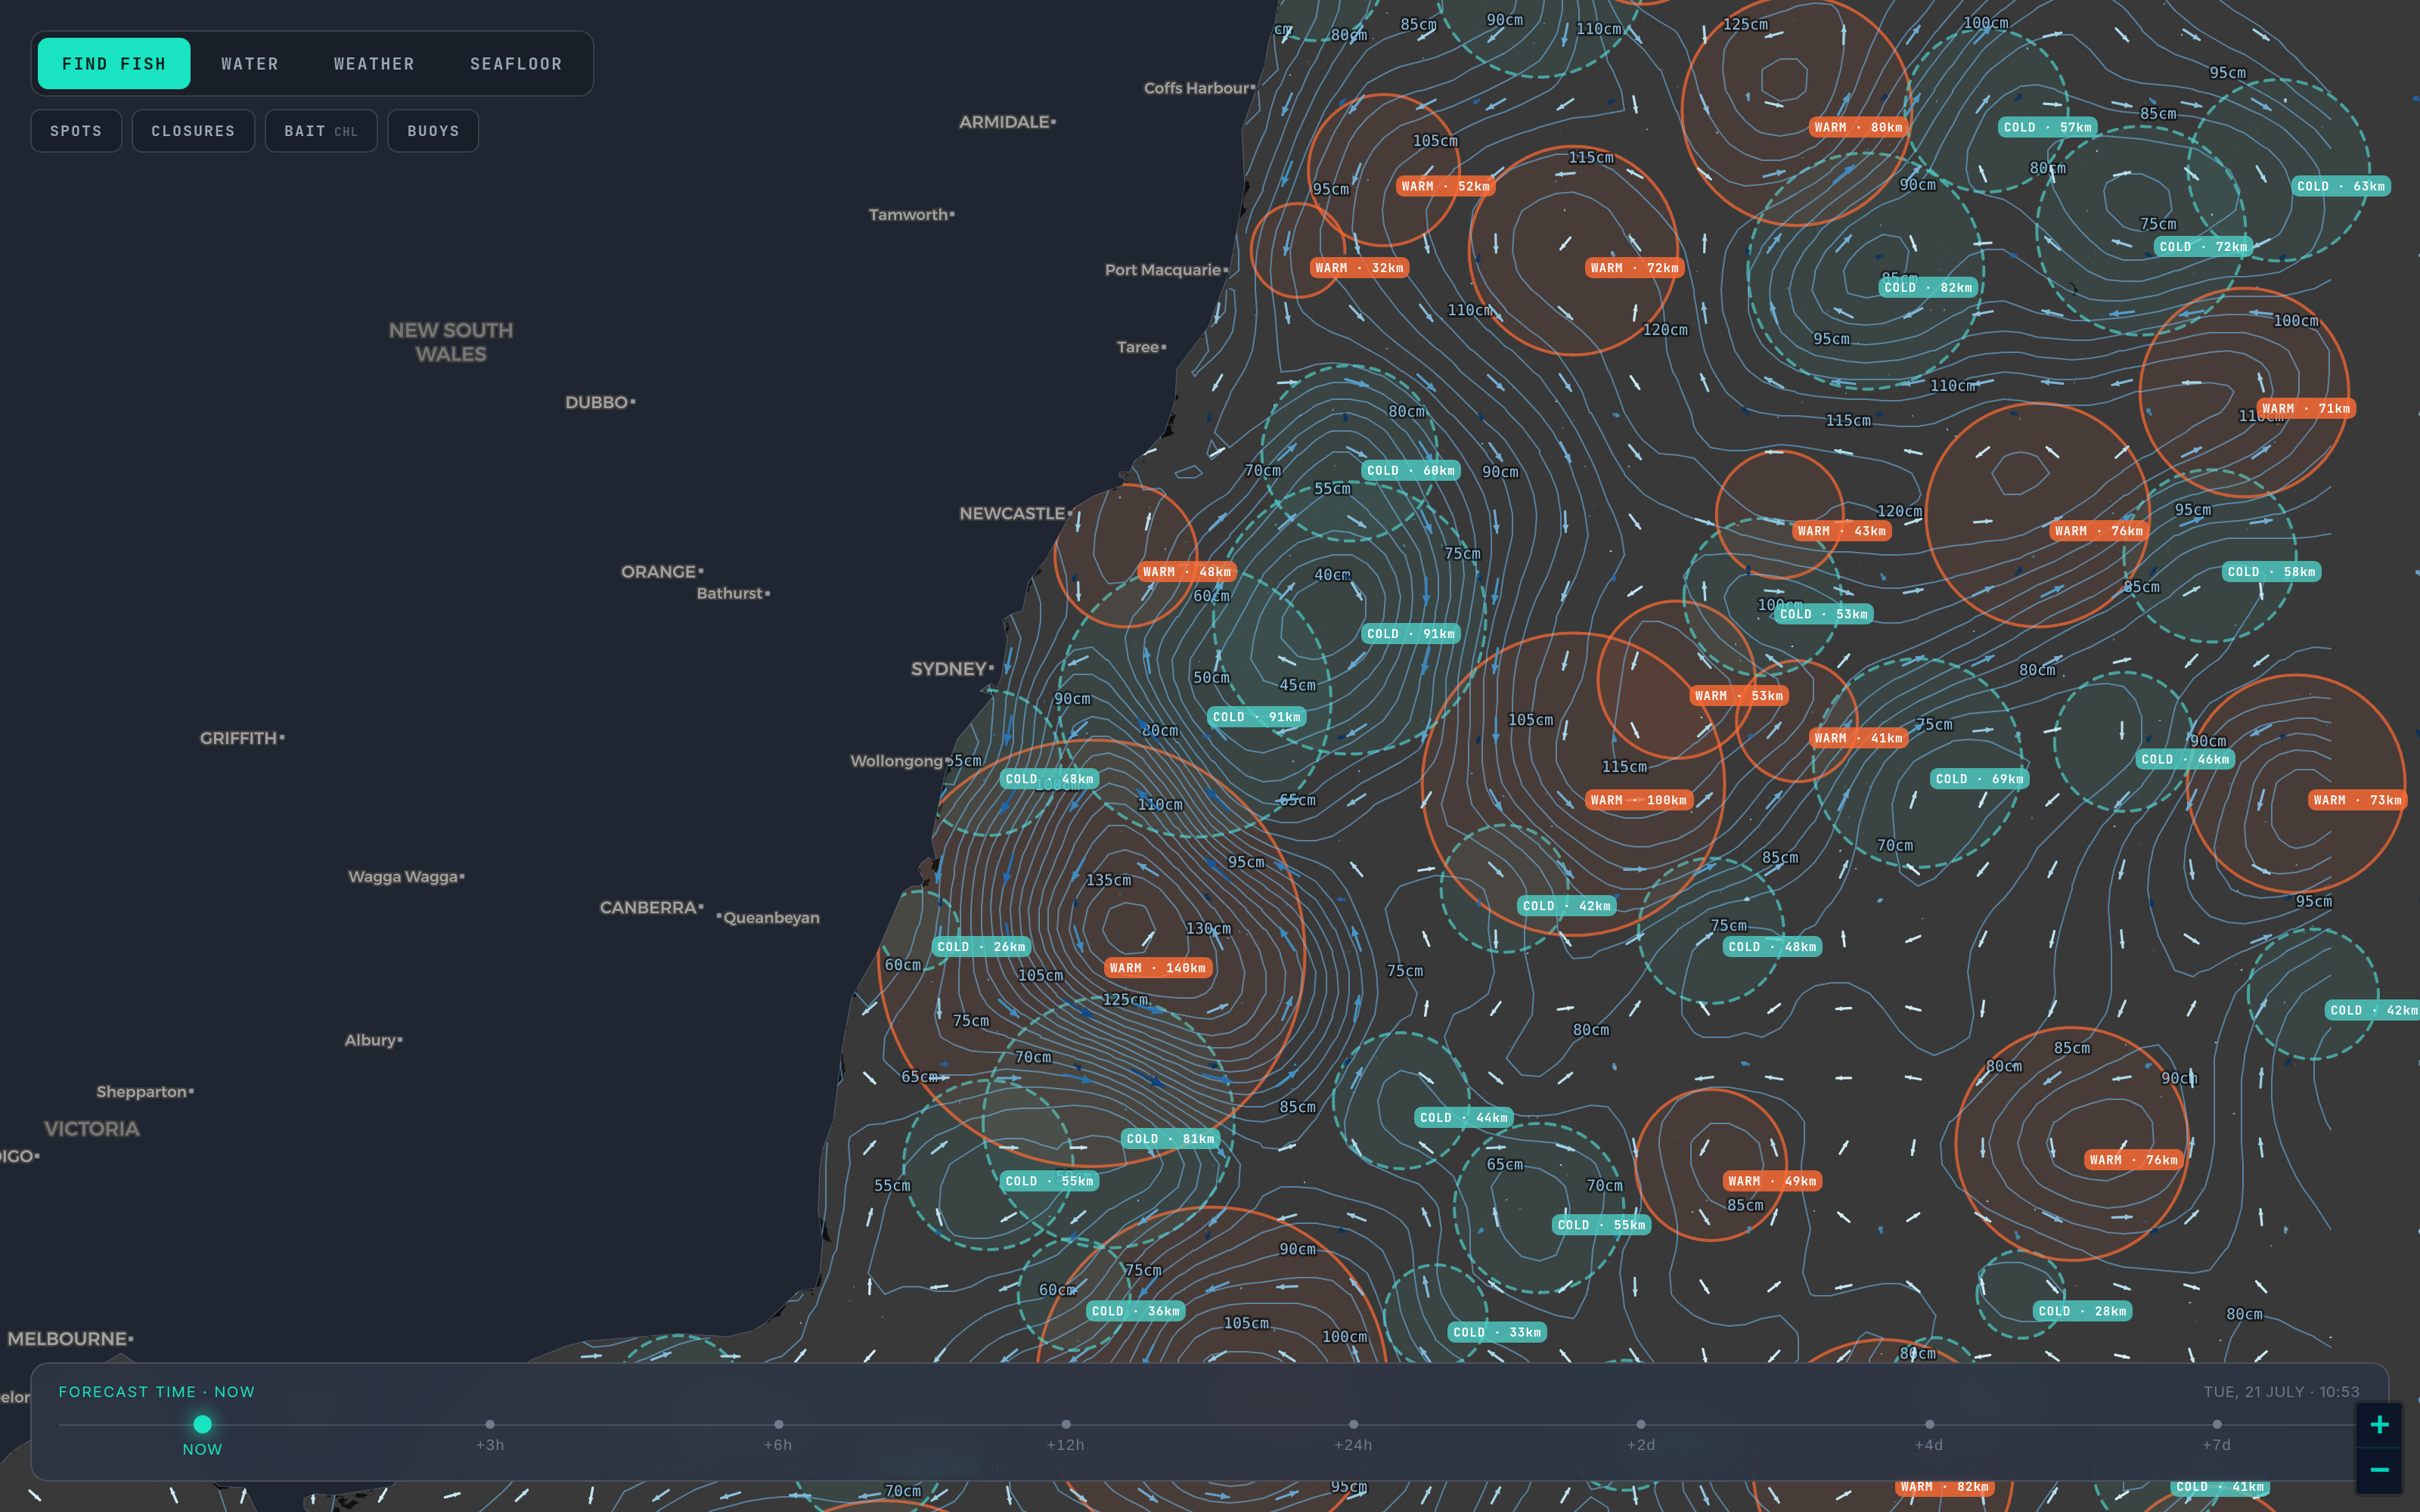
The interpretation is on the map.
The old offshore workflow is a subscription to raw imagery plus years of learning to read it: find the break, judge whether it's real, cross-reference the bathymetry on a separate chart, guess where the eddy edge sits, then steam out and find out if you were right.
We render the field and do the first pass of the reading for you — fronts flagged, eddies ringed, the shelf break already in the score. You still make the call. You just start from a map that has already argued with itself.
Is that break real, or is it sunburn?
Flat, sunny afternoons paint temperature edges on the surface that mean nothing by dawn. The test is whether the boundary survives at depth. Drop the same field to 25, 50 or 100 m and a shallow artefact dissolves while a genuine water-mass edge holds its shape.
Again: modelled, not sensed. The value is in the comparison between levels, not in treating any single number as ground truth.
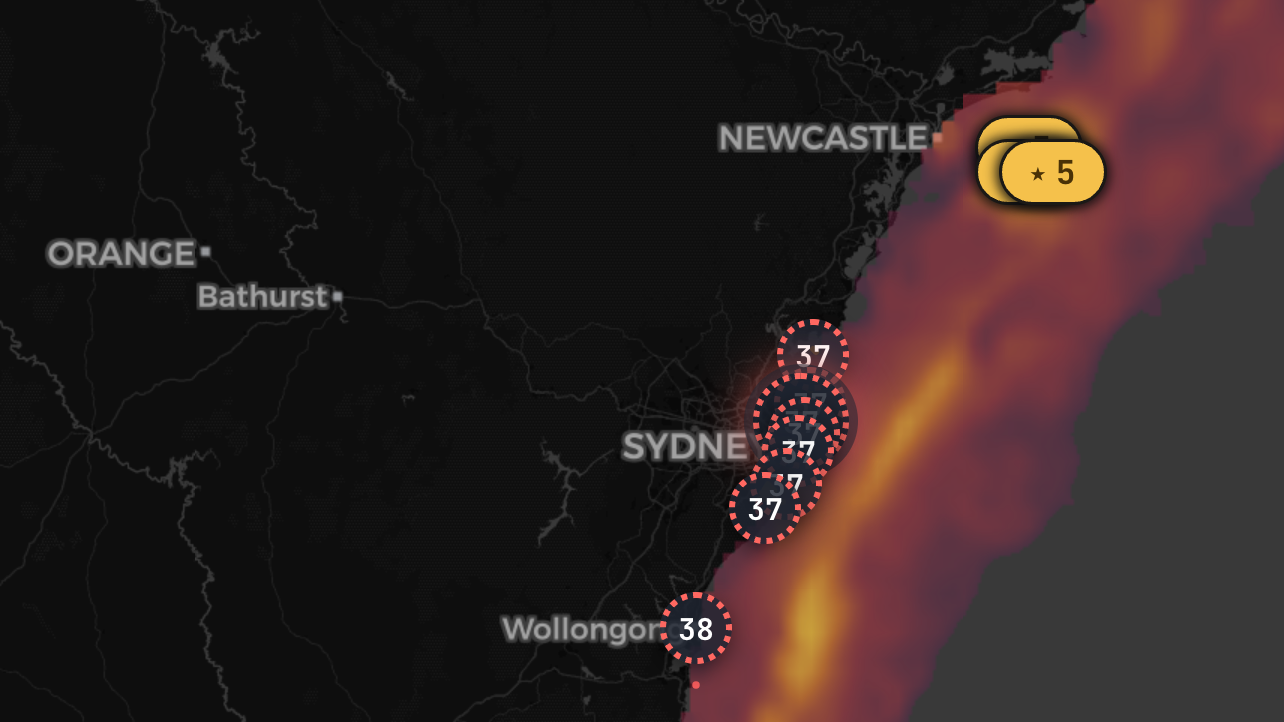
The canyons and the Gulf, too.
The habitat model runs on the US East Coast and the Gulf of Mexico — Atlantic bluefin, yellowfin, white and blue marlin, mahi mahi, wahoo — and in UK and Irish waters for the Atlantic bluefin summer run. One subscription covers every region we cover, not one coastline at a time.
Australia is the most thoroughly calibrated water because that is where most of our validation catches come from. New regions sharpen as catches roll in. The US West Coast is not in the heatmap yet.
The honest column.
An offshore angler who gets burnt by a marketing claim doesn't come back. So here is where we're thin, in our own words, before you pay us anything.
The boat day around the ocean layers.
You don't need a subscription — or an account — to open the map and get a straight answer about tomorrow.
Three tiers, and each one contains the last.
Free is a real product, not a demo. Pro adds the ocean-intelligence layers. Offshore Pro — not on sale yet — will add everything Pro has plus the gear you only need once you're past the heads.
- Bite verdict and the full 14-day forecast
- Wind, swell, tide, pressure and moon
- Sea-state safety read
- Trip tracking with the live route
- Unlimited logbook, unlimited saved spots, catch photos
- Clubs, competitions and season ladders
- Species guides, Fish ID and regulations for 22 jurisdictions
- Our daily SST field with isotherms and break chips
- Tap-to-read temperature in °C
- 7-day playback and a 2-day forecast
- Temperature at SFC / 25 / 50 / 100 m
- Eddies, sea-surface height and currents
- Chlorophyll-a layer
- The HSI habitat heatmap, all covered regions
- Offline trip packs — your plan downloaded before you lose signal
- Launch and bar-crossing windows, not just the grounds
- The bite model tuned to your own logbook
- Priority access to new layers and models
Offshore Pro has no checkout and cannot be bought today, and we have not set a price for it. When we do, the waitlist hears it from us first.
Built for the boat, not the desk.
Offshore Pro is the tier for anglers who run wide: your plan cached before the bars drop out, the ramp and the bar assessed alongside the grounds, and a bite model that has learned how you fish. Leave an address and you'll hear the day it arms — nothing else, no list-selling.
One email at launch. Unsubscribe in a click. Privacy